Assyrian/Chaldean/Syriac vs Dutch Unemployment Among Women with Children Under 6 years
COMPARE
Assyrian/Chaldean/Syriac
Dutch
Unemployment Among Women with Children Under 6 years
Unemployment Among Women with Children Under 6 years Comparison
Assyrians/Chaldeans/Syriacs
Dutch
6.5%
UNEMPLOYMENT AMONG WOMEN WITH CHILDREN UNDER 6 YEARS
100.0/ 100
METRIC RATING
18th/ 347
METRIC RANK
8.1%
UNEMPLOYMENT AMONG WOMEN WITH CHILDREN UNDER 6 YEARS
2.5/ 100
METRIC RATING
242nd/ 347
METRIC RANK
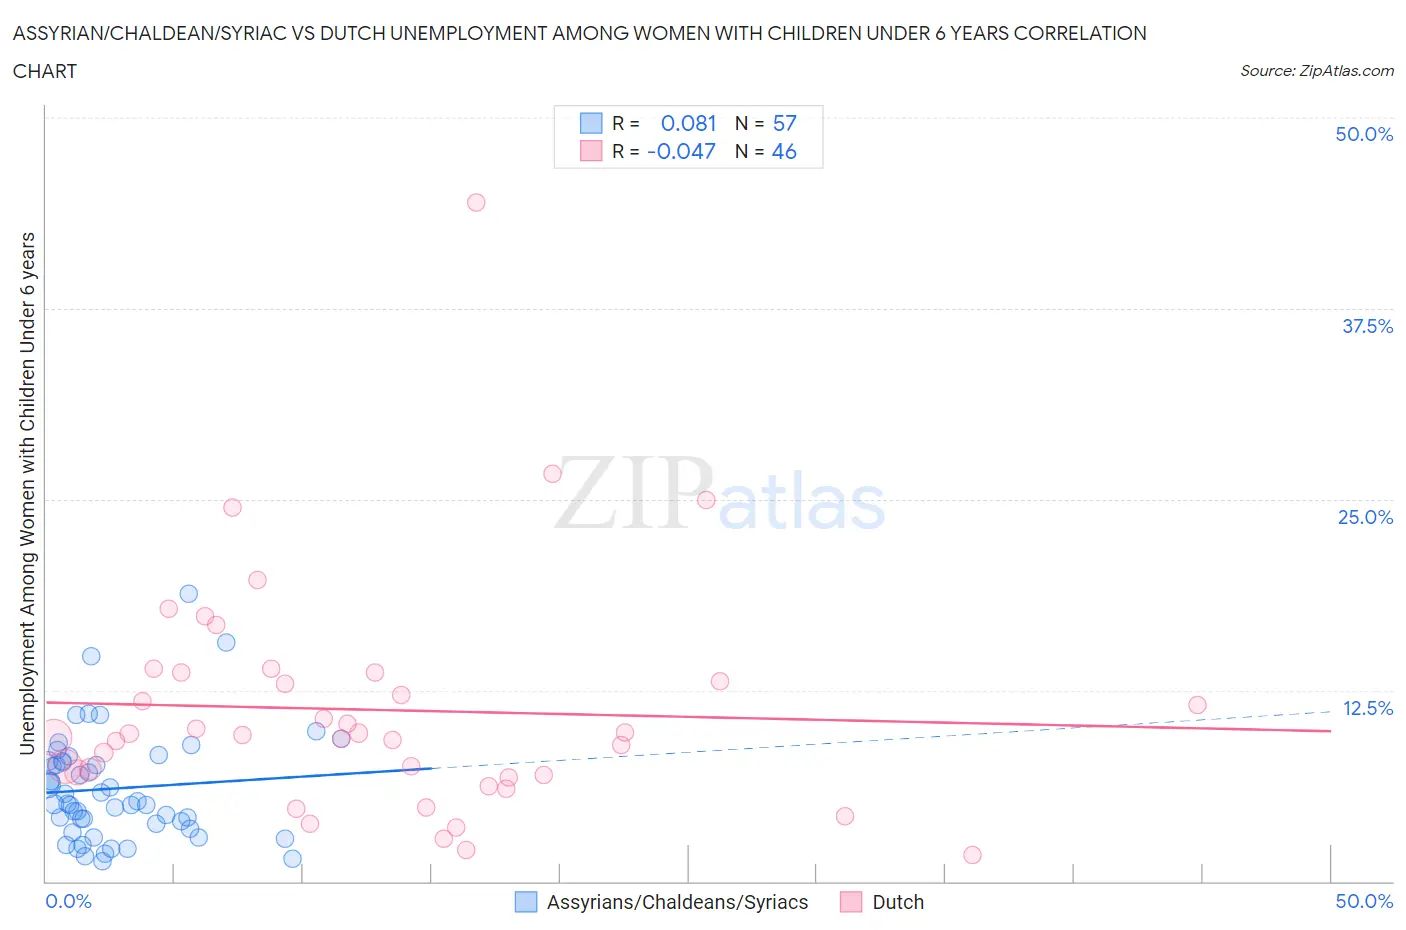
Assyrian/Chaldean/Syriac vs Dutch Unemployment Among Women with Children Under 6 years Correlation Chart
The statistical analysis conducted on geographies consisting of 98,335,487 people shows a slight positive correlation between the proportion of Assyrians/Chaldeans/Syriacs and unemployment rate among women with children under the age of 6 in the United States with a correlation coefficient (R) of 0.081 and weighted average of 6.5%. Similarly, the statistical analysis conducted on geographies consisting of 369,089,937 people shows no correlation between the proportion of Dutch and unemployment rate among women with children under the age of 6 in the United States with a correlation coefficient (R) of -0.047 and weighted average of 8.1%, a difference of 25.7%.
Unemployment Among Women with Children Under 6 years Correlation Summary
| Measurement | Assyrian/Chaldean/Syriac | Dutch |
| Minimum | 1.3% | 1.7% |
| Maximum | 18.8% | 44.4% |
| Range | 17.5% | 42.7% |
| Mean | 6.1% | 11.2% |
| Median | 5.1% | 9.6% |
| Interquartile 25% (IQ1) | 3.6% | 7.0% |
| Interquartile 75% (IQ3) | 7.9% | 13.7% |
| Interquartile Range (IQR) | 4.3% | 6.7% |
| Standard Deviation (Sample) | 3.6% | 7.6% |
| Standard Deviation (Population) | 3.5% | 7.5% |
Similar Demographics by Unemployment Among Women with Children Under 6 years
Demographics Similar to Assyrians/Chaldeans/Syriacs by Unemployment Among Women with Children Under 6 years
In terms of unemployment among women with children under 6 years, the demographic groups most similar to Assyrians/Chaldeans/Syriacs are Mongolian (6.5%, a difference of 0.32%), Ute (6.5%, a difference of 0.38%), Burmese (6.5%, a difference of 0.43%), Immigrants from Korea (6.5%, a difference of 0.85%), and Immigrants from Malaysia (6.4%, a difference of 0.98%).
| Demographics | Rating | Rank | Unemployment Among Women with Children Under 6 years |
| Indians (Asian) | 100.0 /100 | #11 | Exceptional 6.3% |
| Immigrants | Singapore | 100.0 /100 | #12 | Exceptional 6.3% |
| Immigrants | Eastern Asia | 100.0 /100 | #13 | Exceptional 6.3% |
| Immigrants | Bulgaria | 100.0 /100 | #14 | Exceptional 6.3% |
| Thais | 100.0 /100 | #15 | Exceptional 6.3% |
| Immigrants | Uzbekistan | 100.0 /100 | #16 | Exceptional 6.3% |
| Immigrants | Malaysia | 100.0 /100 | #17 | Exceptional 6.4% |
| Assyrians/Chaldeans/Syriacs | 100.0 /100 | #18 | Exceptional 6.5% |
| Mongolians | 100.0 /100 | #19 | Exceptional 6.5% |
| Ute | 100.0 /100 | #20 | Exceptional 6.5% |
| Burmese | 100.0 /100 | #21 | Exceptional 6.5% |
| Immigrants | Korea | 100.0 /100 | #22 | Exceptional 6.5% |
| Bulgarians | 100.0 /100 | #23 | Exceptional 6.5% |
| Laotians | 100.0 /100 | #24 | Exceptional 6.5% |
| Soviet Union | 100.0 /100 | #25 | Exceptional 6.5% |
Demographics Similar to Dutch by Unemployment Among Women with Children Under 6 years
In terms of unemployment among women with children under 6 years, the demographic groups most similar to Dutch are Liberian (8.1%, a difference of 0.060%), Immigrants from El Salvador (8.1%, a difference of 0.080%), Irish (8.1%, a difference of 0.16%), Immigrants from Middle Africa (8.1%, a difference of 0.42%), and Hawaiian (8.2%, a difference of 0.56%).
| Demographics | Rating | Rank | Unemployment Among Women with Children Under 6 years |
| Comanche | 4.3 /100 | #235 | Tragic 8.0% |
| Immigrants | Barbados | 4.2 /100 | #236 | Tragic 8.0% |
| Immigrants | Costa Rica | 4.1 /100 | #237 | Tragic 8.0% |
| Immigrants | Middle Africa | 3.2 /100 | #238 | Tragic 8.1% |
| Irish | 2.7 /100 | #239 | Tragic 8.1% |
| Immigrants | El Salvador | 2.6 /100 | #240 | Tragic 8.1% |
| Liberians | 2.6 /100 | #241 | Tragic 8.1% |
| Dutch | 2.5 /100 | #242 | Tragic 8.1% |
| Hawaiians | 1.8 /100 | #243 | Tragic 8.2% |
| French | 1.7 /100 | #244 | Tragic 8.2% |
| Native Hawaiians | 1.7 /100 | #245 | Tragic 8.2% |
| Central Americans | 1.4 /100 | #246 | Tragic 8.2% |
| German Russians | 1.2 /100 | #247 | Tragic 8.2% |
| Immigrants | Western Africa | 1.1 /100 | #248 | Tragic 8.2% |
| Immigrants | Sierra Leone | 1.1 /100 | #249 | Tragic 8.2% |