Hungarian vs Nepalese Unemployment Among Ages 65 to 74 years
COMPARE
Hungarian
Nepalese
Unemployment Among Ages 65 to 74 years
Unemployment Among Ages 65 to 74 years Comparison
Hungarians
Nepalese
5.5%
UNEMPLOYMENT AMONG AGES 65 TO 74 YEARS
4.4/ 100
METRIC RATING
223rd/ 347
METRIC RANK
5.0%
UNEMPLOYMENT AMONG AGES 65 TO 74 YEARS
99.9/ 100
METRIC RATING
38th/ 347
METRIC RANK
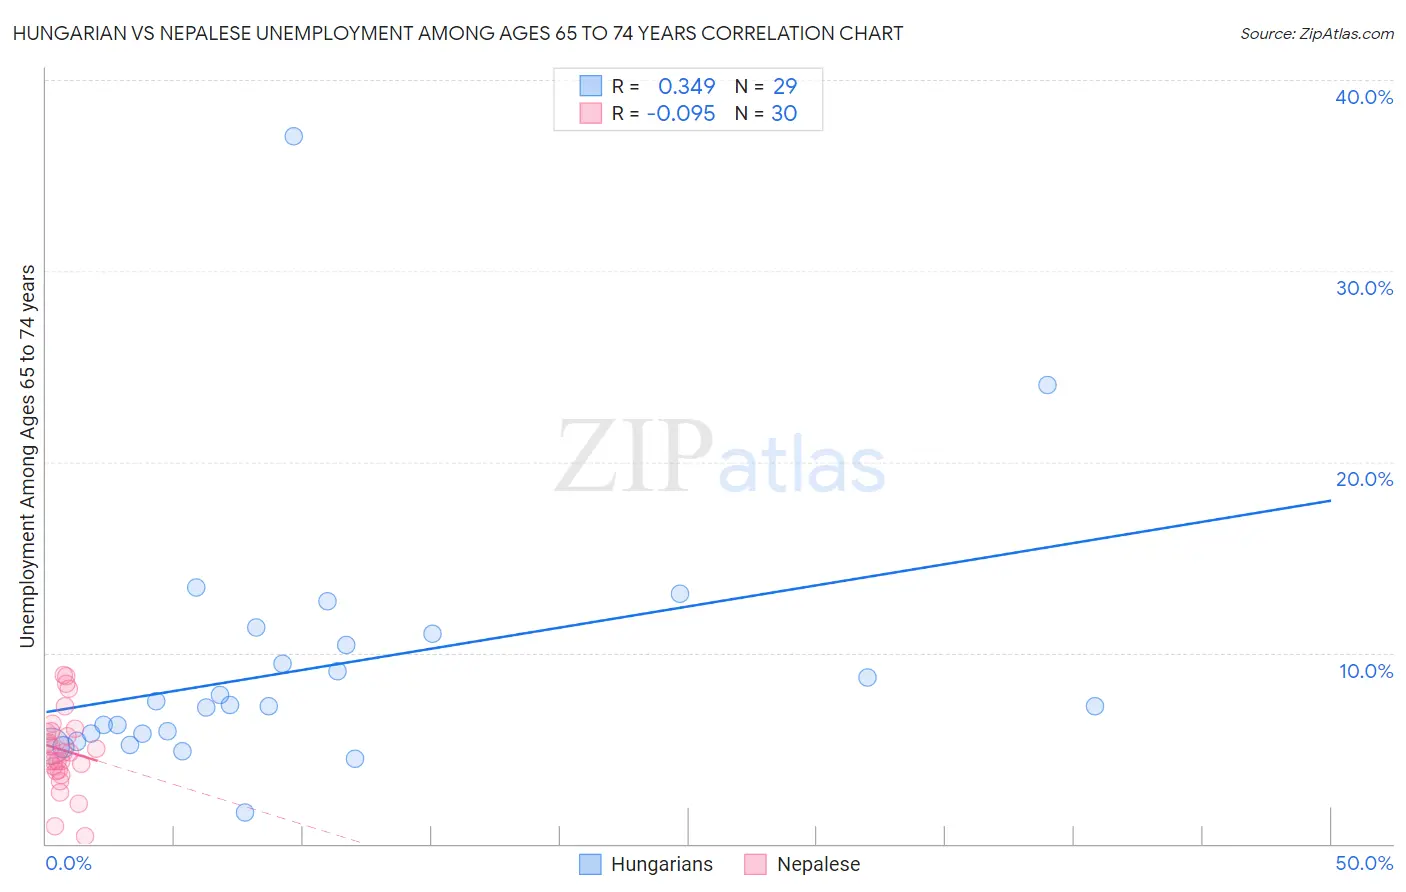
Hungarian vs Nepalese Unemployment Among Ages 65 to 74 years Correlation Chart
The statistical analysis conducted on geographies consisting of 405,744,527 people shows a mild positive correlation between the proportion of Hungarians and unemployment rate among population between the ages 65 and 74 in the United States with a correlation coefficient (R) of 0.349 and weighted average of 5.5%. Similarly, the statistical analysis conducted on geographies consisting of 23,862,004 people shows a slight negative correlation between the proportion of Nepalese and unemployment rate among population between the ages 65 and 74 in the United States with a correlation coefficient (R) of -0.095 and weighted average of 5.0%, a difference of 9.1%.
Unemployment Among Ages 65 to 74 years Correlation Summary
| Measurement | Hungarian | Nepalese |
| Minimum | 1.7% | 0.40% |
| Maximum | 37.0% | 8.8% |
| Range | 35.4% | 8.4% |
| Mean | 9.2% | 4.9% |
| Median | 7.2% | 4.8% |
| Interquartile 25% (IQ1) | 5.6% | 3.9% |
| Interquartile 75% (IQ3) | 10.7% | 5.9% |
| Interquartile Range (IQR) | 5.1% | 2.1% |
| Standard Deviation (Sample) | 6.8% | 2.1% |
| Standard Deviation (Population) | 6.7% | 2.0% |
Similar Demographics by Unemployment Among Ages 65 to 74 years
Demographics Similar to Hungarians by Unemployment Among Ages 65 to 74 years
In terms of unemployment among ages 65 to 74 years, the demographic groups most similar to Hungarians are Apache (5.5%, a difference of 0.010%), Immigrants from Uruguay (5.5%, a difference of 0.050%), Spaniard (5.5%, a difference of 0.060%), Immigrants from Trinidad and Tobago (5.5%, a difference of 0.060%), and Immigrants from Syria (5.5%, a difference of 0.11%).
| Demographics | Rating | Rank | Unemployment Among Ages 65 to 74 years |
| Uruguayans | 6.2 /100 | #216 | Tragic 5.5% |
| Blackfeet | 5.8 /100 | #217 | Tragic 5.5% |
| Samoans | 5.7 /100 | #218 | Tragic 5.5% |
| Alsatians | 5.6 /100 | #219 | Tragic 5.5% |
| Immigrants | Syria | 5.1 /100 | #220 | Tragic 5.5% |
| Spaniards | 4.8 /100 | #221 | Tragic 5.5% |
| Apache | 4.5 /100 | #222 | Tragic 5.5% |
| Hungarians | 4.4 /100 | #223 | Tragic 5.5% |
| Immigrants | Uruguay | 4.2 /100 | #224 | Tragic 5.5% |
| Immigrants | Trinidad and Tobago | 4.1 /100 | #225 | Tragic 5.5% |
| Hondurans | 3.7 /100 | #226 | Tragic 5.5% |
| Immigrants | Albania | 3.7 /100 | #227 | Tragic 5.5% |
| Immigrants | Israel | 3.0 /100 | #228 | Tragic 5.5% |
| West Indians | 2.7 /100 | #229 | Tragic 5.5% |
| Immigrants | Caribbean | 2.7 /100 | #230 | Tragic 5.5% |
Demographics Similar to Nepalese by Unemployment Among Ages 65 to 74 years
In terms of unemployment among ages 65 to 74 years, the demographic groups most similar to Nepalese are Immigrants from Sweden (5.0%, a difference of 0.010%), Immigrants from Iraq (5.1%, a difference of 0.19%), Ugandan (5.1%, a difference of 0.20%), Immigrants from Eastern Africa (5.0%, a difference of 0.22%), and Immigrants from Kuwait (5.0%, a difference of 0.24%).
| Demographics | Rating | Rank | Unemployment Among Ages 65 to 74 years |
| Slovenes | 100.0 /100 | #31 | Exceptional 5.0% |
| Palestinians | 100.0 /100 | #32 | Exceptional 5.0% |
| Belgians | 100.0 /100 | #33 | Exceptional 5.0% |
| Cambodians | 100.0 /100 | #34 | Exceptional 5.0% |
| Bhutanese | 100.0 /100 | #35 | Exceptional 5.0% |
| Immigrants | Kuwait | 99.9 /100 | #36 | Exceptional 5.0% |
| Immigrants | Eastern Africa | 99.9 /100 | #37 | Exceptional 5.0% |
| Nepalese | 99.9 /100 | #38 | Exceptional 5.0% |
| Immigrants | Sweden | 99.9 /100 | #39 | Exceptional 5.0% |
| Immigrants | Iraq | 99.9 /100 | #40 | Exceptional 5.1% |
| Ugandans | 99.9 /100 | #41 | Exceptional 5.1% |
| Jordanians | 99.9 /100 | #42 | Exceptional 5.1% |
| Assyrians/Chaldeans/Syriacs | 99.9 /100 | #43 | Exceptional 5.1% |
| Immigrants | India | 99.9 /100 | #44 | Exceptional 5.1% |
| Sioux | 99.8 /100 | #45 | Exceptional 5.1% |