Immigrants from Nepal vs Immigrants from Panama Female Unemployment
COMPARE
Immigrants from Nepal
Immigrants from Panama
Female Unemployment
Female Unemployment Comparison
Immigrants from Nepal
Immigrants from Panama
4.9%
FEMALE UNEMPLOYMENT
98.6/ 100
METRIC RATING
62nd/ 347
METRIC RANK
5.5%
FEMALE UNEMPLOYMENT
3.2/ 100
METRIC RATING
237th/ 347
METRIC RANK
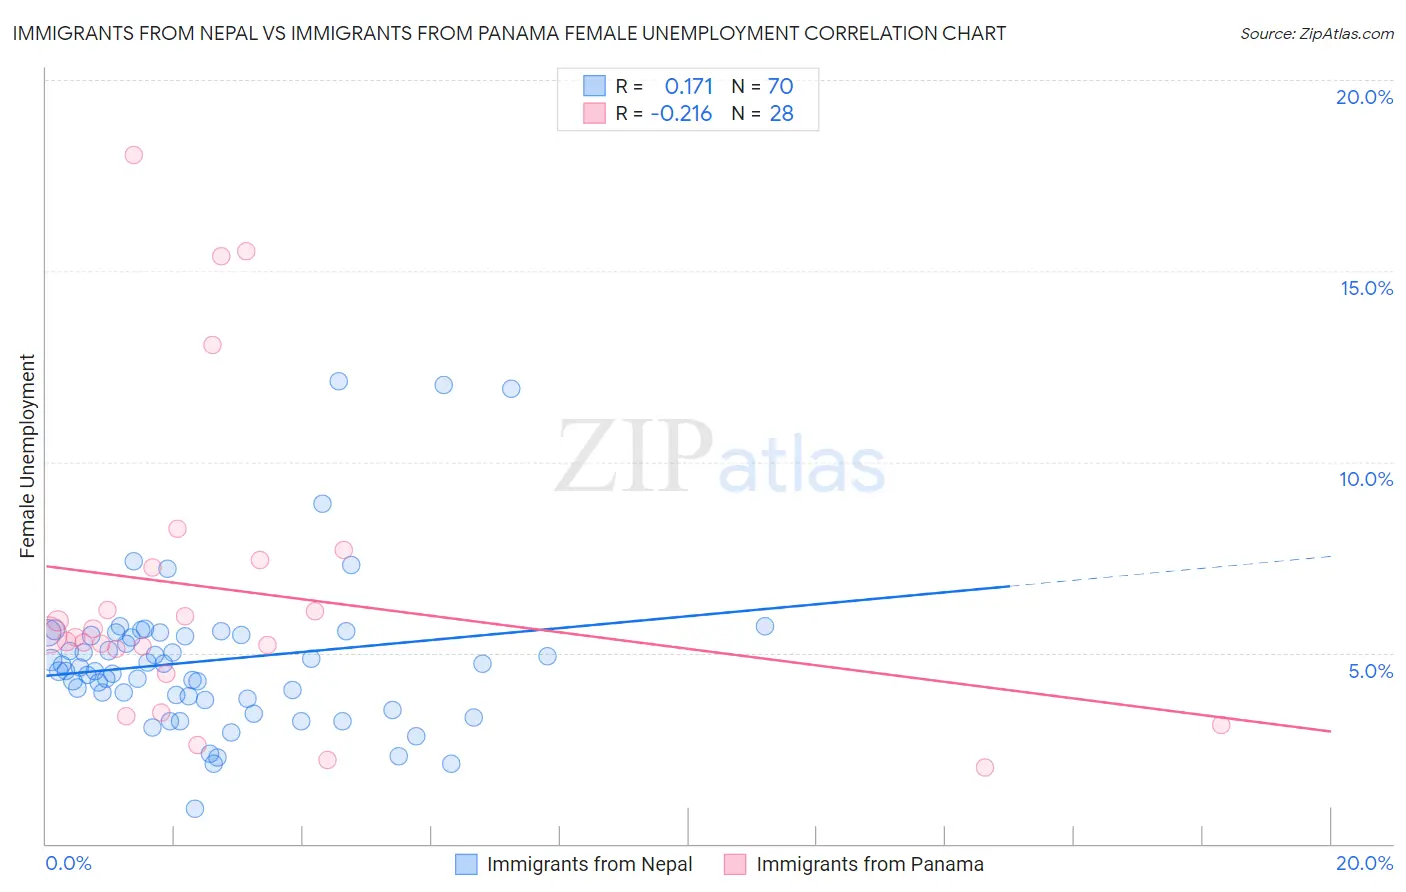
Immigrants from Nepal vs Immigrants from Panama Female Unemployment Correlation Chart
The statistical analysis conducted on geographies consisting of 186,597,918 people shows a poor positive correlation between the proportion of Immigrants from Nepal and unemploymnet rate among females in the United States with a correlation coefficient (R) of 0.171 and weighted average of 4.9%. Similarly, the statistical analysis conducted on geographies consisting of 220,928,919 people shows a weak negative correlation between the proportion of Immigrants from Panama and unemploymnet rate among females in the United States with a correlation coefficient (R) of -0.216 and weighted average of 5.5%, a difference of 12.3%.
Female Unemployment Correlation Summary
| Measurement | Immigrants from Nepal | Immigrants from Panama |
| Minimum | 0.93% | 2.0% |
| Maximum | 12.1% | 18.0% |
| Range | 11.2% | 16.0% |
| Mean | 4.8% | 6.6% |
| Median | 4.6% | 5.4% |
| Interquartile 25% (IQ1) | 3.8% | 4.8% |
| Interquartile 75% (IQ3) | 5.5% | 7.3% |
| Interquartile Range (IQR) | 1.7% | 2.6% |
| Standard Deviation (Sample) | 2.0% | 4.1% |
| Standard Deviation (Population) | 2.0% | 4.0% |
Similar Demographics by Female Unemployment
Demographics Similar to Immigrants from Nepal by Female Unemployment
In terms of female unemployment, the demographic groups most similar to Immigrants from Nepal are Immigrants from Canada (4.9%, a difference of 0.0%), Immigrants from Scotland (4.9%, a difference of 0.010%), Bhutanese (4.9%, a difference of 0.090%), Immigrants from Belgium (4.9%, a difference of 0.11%), and Celtic (4.9%, a difference of 0.12%).
| Demographics | Rating | Rank | Female Unemployment |
| Immigrants | Moldova | 99.0 /100 | #55 | Exceptional 4.9% |
| Serbians | 99.0 /100 | #56 | Exceptional 4.9% |
| Icelanders | 98.8 /100 | #57 | Exceptional 4.9% |
| Immigrants | Lithuania | 98.8 /100 | #58 | Exceptional 4.9% |
| Bhutanese | 98.7 /100 | #59 | Exceptional 4.9% |
| Immigrants | Scotland | 98.6 /100 | #60 | Exceptional 4.9% |
| Immigrants | Canada | 98.6 /100 | #61 | Exceptional 4.9% |
| Immigrants | Nepal | 98.6 /100 | #62 | Exceptional 4.9% |
| Immigrants | Belgium | 98.5 /100 | #63 | Exceptional 4.9% |
| Celtics | 98.5 /100 | #64 | Exceptional 4.9% |
| Immigrants | North America | 98.3 /100 | #65 | Exceptional 4.9% |
| Hungarians | 98.3 /100 | #66 | Exceptional 4.9% |
| Cubans | 98.3 /100 | #67 | Exceptional 4.9% |
| Tlingit-Haida | 98.3 /100 | #68 | Exceptional 4.9% |
| Immigrants | Ireland | 98.2 /100 | #69 | Exceptional 4.9% |
Demographics Similar to Immigrants from Panama by Female Unemployment
In terms of female unemployment, the demographic groups most similar to Immigrants from Panama are Immigrants from Cambodia (5.5%, a difference of 0.020%), Sierra Leonean (5.5%, a difference of 0.020%), Immigrants from Lebanon (5.5%, a difference of 0.060%), Immigrants from Iran (5.5%, a difference of 0.060%), and Moroccan (5.5%, a difference of 0.080%).
| Demographics | Rating | Rank | Female Unemployment |
| Immigrants | Uruguay | 4.7 /100 | #230 | Tragic 5.5% |
| Immigrants | Iraq | 3.9 /100 | #231 | Tragic 5.5% |
| Liberians | 3.9 /100 | #232 | Tragic 5.5% |
| Moroccans | 3.4 /100 | #233 | Tragic 5.5% |
| Immigrants | Lebanon | 3.3 /100 | #234 | Tragic 5.5% |
| Immigrants | Iran | 3.3 /100 | #235 | Tragic 5.5% |
| Immigrants | Cambodia | 3.3 /100 | #236 | Tragic 5.5% |
| Immigrants | Panama | 3.2 /100 | #237 | Tragic 5.5% |
| Sierra Leoneans | 3.2 /100 | #238 | Tragic 5.5% |
| Aleuts | 3.0 /100 | #239 | Tragic 5.5% |
| Immigrants | South America | 2.9 /100 | #240 | Tragic 5.5% |
| South American Indians | 2.8 /100 | #241 | Tragic 5.5% |
| Marshallese | 2.3 /100 | #242 | Tragic 5.6% |
| Spanish Americans | 2.2 /100 | #243 | Tragic 5.6% |
| Immigrants | Liberia | 1.5 /100 | #244 | Tragic 5.6% |