Hungarian vs Navajo Female Unemployment
COMPARE
Hungarian
Navajo
Female Unemployment
Female Unemployment Comparison
Hungarians
Navajo
4.9%
FEMALE UNEMPLOYMENT
98.3/ 100
METRIC RATING
66th/ 347
METRIC RANK
7.3%
FEMALE UNEMPLOYMENT
0.0/ 100
METRIC RATING
337th/ 347
METRIC RANK
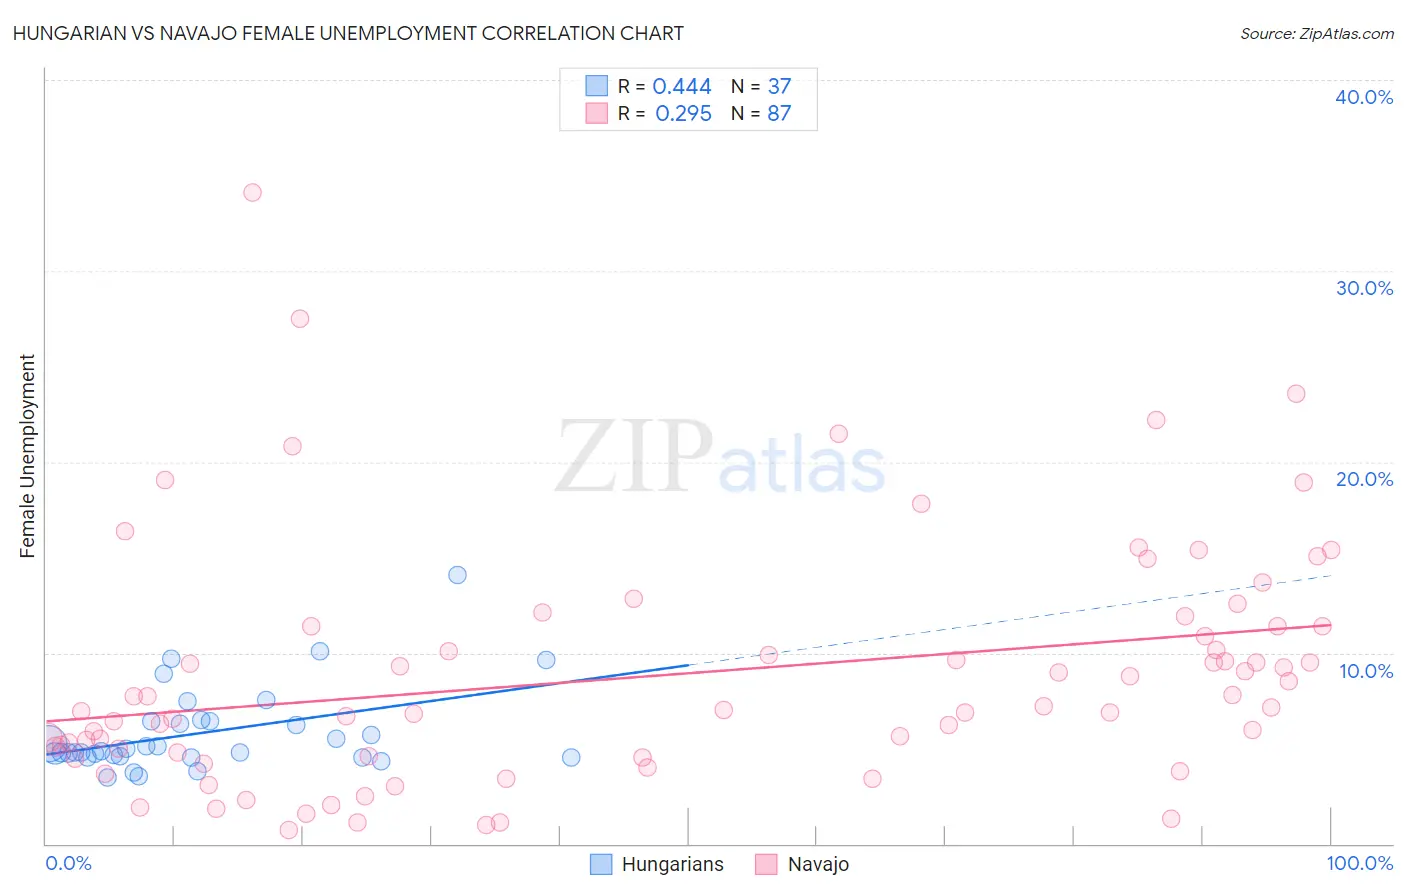
Hungarian vs Navajo Female Unemployment Correlation Chart
The statistical analysis conducted on geographies consisting of 480,650,444 people shows a moderate positive correlation between the proportion of Hungarians and unemploymnet rate among females in the United States with a correlation coefficient (R) of 0.444 and weighted average of 4.9%. Similarly, the statistical analysis conducted on geographies consisting of 223,861,194 people shows a weak positive correlation between the proportion of Navajo and unemploymnet rate among females in the United States with a correlation coefficient (R) of 0.295 and weighted average of 7.3%, a difference of 47.6%.
Female Unemployment Correlation Summary
| Measurement | Hungarian | Navajo |
| Minimum | 3.5% | 0.70% |
| Maximum | 14.1% | 34.1% |
| Range | 10.6% | 33.4% |
| Mean | 5.8% | 8.9% |
| Median | 4.8% | 7.2% |
| Interquartile 25% (IQ1) | 4.6% | 4.6% |
| Interquartile 75% (IQ3) | 6.4% | 11.4% |
| Interquartile Range (IQR) | 1.9% | 6.8% |
| Standard Deviation (Sample) | 2.2% | 6.3% |
| Standard Deviation (Population) | 2.2% | 6.2% |
Similar Demographics by Female Unemployment
Demographics Similar to Hungarians by Female Unemployment
In terms of female unemployment, the demographic groups most similar to Hungarians are Cuban (4.9%, a difference of 0.0%), Tlingit-Haida (4.9%, a difference of 0.010%), Immigrants from Ireland (4.9%, a difference of 0.020%), Immigrants from North America (4.9%, a difference of 0.030%), and Osage (4.9%, a difference of 0.060%).
| Demographics | Rating | Rank | Female Unemployment |
| Bhutanese | 98.7 /100 | #59 | Exceptional 4.9% |
| Immigrants | Scotland | 98.6 /100 | #60 | Exceptional 4.9% |
| Immigrants | Canada | 98.6 /100 | #61 | Exceptional 4.9% |
| Immigrants | Nepal | 98.6 /100 | #62 | Exceptional 4.9% |
| Immigrants | Belgium | 98.5 /100 | #63 | Exceptional 4.9% |
| Celtics | 98.5 /100 | #64 | Exceptional 4.9% |
| Immigrants | North America | 98.3 /100 | #65 | Exceptional 4.9% |
| Hungarians | 98.3 /100 | #66 | Exceptional 4.9% |
| Cubans | 98.3 /100 | #67 | Exceptional 4.9% |
| Tlingit-Haida | 98.3 /100 | #68 | Exceptional 4.9% |
| Immigrants | Ireland | 98.2 /100 | #69 | Exceptional 4.9% |
| Osage | 98.2 /100 | #70 | Exceptional 4.9% |
| German Russians | 98.1 /100 | #71 | Exceptional 4.9% |
| Immigrants | Northern Europe | 98.0 /100 | #72 | Exceptional 4.9% |
| Russians | 98.0 /100 | #73 | Exceptional 5.0% |
Demographics Similar to Navajo by Female Unemployment
In terms of female unemployment, the demographic groups most similar to Navajo are Immigrants from Dominican Republic (7.2%, a difference of 0.94%), Dominican (7.2%, a difference of 1.6%), Immigrants from Armenia (7.1%, a difference of 3.0%), Menominee (7.0%, a difference of 3.5%), and Sioux (7.0%, a difference of 3.5%).
| Demographics | Rating | Rank | Female Unemployment |
| Yakama | 0.0 /100 | #330 | Tragic 6.7% |
| Paiute | 0.0 /100 | #331 | Tragic 6.8% |
| Sioux | 0.0 /100 | #332 | Tragic 7.0% |
| Menominee | 0.0 /100 | #333 | Tragic 7.0% |
| Immigrants | Armenia | 0.0 /100 | #334 | Tragic 7.1% |
| Dominicans | 0.0 /100 | #335 | Tragic 7.2% |
| Immigrants | Dominican Republic | 0.0 /100 | #336 | Tragic 7.2% |
| Navajo | 0.0 /100 | #337 | Tragic 7.3% |
| Tohono O'odham | 0.0 /100 | #338 | Tragic 7.7% |
| Immigrants | Yemen | 0.0 /100 | #339 | Tragic 7.8% |
| Hopi | 0.0 /100 | #340 | Tragic 8.1% |
| Inupiat | 0.0 /100 | #341 | Tragic 8.2% |
| Puerto Ricans | 0.0 /100 | #342 | Tragic 8.3% |
| Arapaho | 0.0 /100 | #343 | Tragic 8.8% |
| Pima | 0.0 /100 | #344 | Tragic 9.3% |