Honduran vs Immigrants from Switzerland Unemployment Among Women with Children Under 18 years
COMPARE
Honduran
Immigrants from Switzerland
Unemployment Among Women with Children Under 18 years
Unemployment Among Women with Children Under 18 years Comparison
Hondurans
Immigrants from Switzerland
6.4%
UNEMPLOYMENT AMONG WOMEN WITH CHILDREN UNDER 18 YEARS
0.0/ 100
METRIC RATING
294th/ 347
METRIC RANK
5.2%
UNEMPLOYMENT AMONG WOMEN WITH CHILDREN UNDER 18 YEARS
90.1/ 100
METRIC RATING
104th/ 347
METRIC RANK
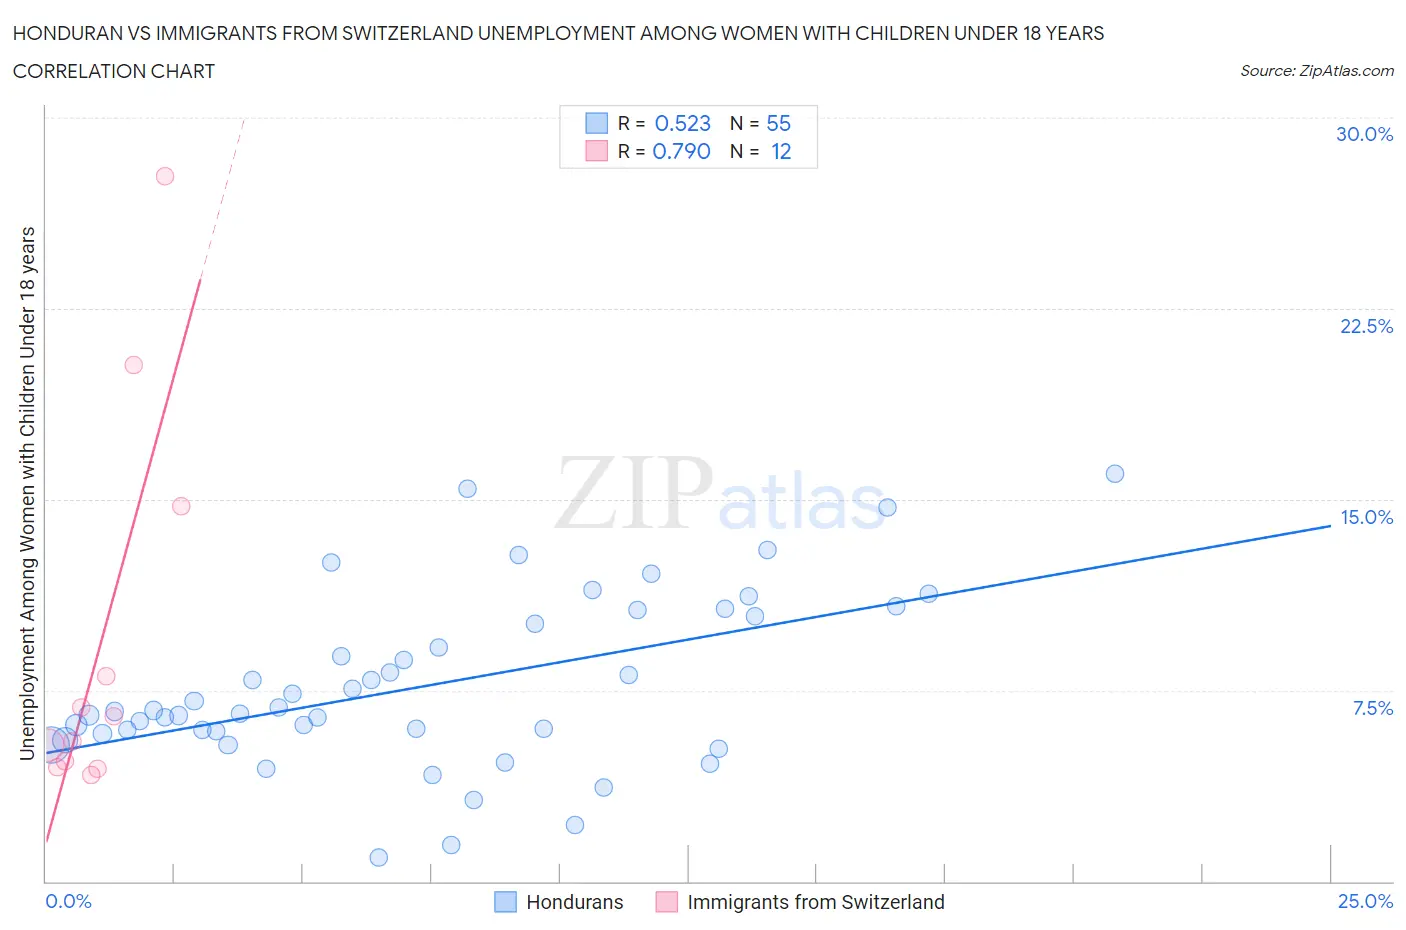
Honduran vs Immigrants from Switzerland Unemployment Among Women with Children Under 18 years Correlation Chart
The statistical analysis conducted on geographies consisting of 348,078,554 people shows a substantial positive correlation between the proportion of Hondurans and unemployment rate among women with children under the age of 18 in the United States with a correlation coefficient (R) of 0.523 and weighted average of 6.4%. Similarly, the statistical analysis conducted on geographies consisting of 144,588,727 people shows a strong positive correlation between the proportion of Immigrants from Switzerland and unemployment rate among women with children under the age of 18 in the United States with a correlation coefficient (R) of 0.790 and weighted average of 5.2%, a difference of 22.0%.
Unemployment Among Women with Children Under 18 years Correlation Summary
| Measurement | Honduran | Immigrants from Switzerland |
| Minimum | 0.93% | 4.2% |
| Maximum | 16.0% | 27.7% |
| Range | 15.1% | 23.5% |
| Mean | 7.7% | 9.4% |
| Median | 6.7% | 6.0% |
| Interquartile 25% (IQ1) | 5.8% | 4.6% |
| Interquartile 75% (IQ3) | 10.4% | 11.4% |
| Interquartile Range (IQR) | 4.6% | 6.8% |
| Standard Deviation (Sample) | 3.4% | 7.6% |
| Standard Deviation (Population) | 3.3% | 7.2% |
Similar Demographics by Unemployment Among Women with Children Under 18 years
Demographics Similar to Hondurans by Unemployment Among Women with Children Under 18 years
In terms of unemployment among women with children under 18 years, the demographic groups most similar to Hondurans are Immigrants from Bangladesh (6.4%, a difference of 0.030%), Mexican (6.4%, a difference of 0.060%), Barbadian (6.4%, a difference of 0.080%), Haitian (6.4%, a difference of 0.10%), and Immigrants from Guatemala (6.4%, a difference of 0.12%).
| Demographics | Rating | Rank | Unemployment Among Women with Children Under 18 years |
| Kiowa | 0.0 /100 | #287 | Tragic 6.3% |
| Cree | 0.0 /100 | #288 | Tragic 6.3% |
| Immigrants | Caribbean | 0.0 /100 | #289 | Tragic 6.4% |
| Blackfeet | 0.0 /100 | #290 | Tragic 6.4% |
| Immigrants | Guatemala | 0.0 /100 | #291 | Tragic 6.4% |
| Mexicans | 0.0 /100 | #292 | Tragic 6.4% |
| Immigrants | Bangladesh | 0.0 /100 | #293 | Tragic 6.4% |
| Hondurans | 0.0 /100 | #294 | Tragic 6.4% |
| Barbadians | 0.0 /100 | #295 | Tragic 6.4% |
| Haitians | 0.0 /100 | #296 | Tragic 6.4% |
| Immigrants | Senegal | 0.0 /100 | #297 | Tragic 6.4% |
| Immigrants | Latin America | 0.0 /100 | #298 | Tragic 6.4% |
| Jamaicans | 0.0 /100 | #299 | Tragic 6.4% |
| Immigrants | Jamaica | 0.0 /100 | #300 | Tragic 6.4% |
| Immigrants | Haiti | 0.0 /100 | #301 | Tragic 6.4% |
Demographics Similar to Immigrants from Switzerland by Unemployment Among Women with Children Under 18 years
In terms of unemployment among women with children under 18 years, the demographic groups most similar to Immigrants from Switzerland are Immigrants from France (5.2%, a difference of 0.020%), Sri Lankan (5.2%, a difference of 0.040%), Pakistani (5.2%, a difference of 0.050%), Slavic (5.2%, a difference of 0.050%), and Iranian (5.2%, a difference of 0.090%).
| Demographics | Rating | Rank | Unemployment Among Women with Children Under 18 years |
| Palestinians | 92.2 /100 | #97 | Exceptional 5.2% |
| Immigrants | Vietnam | 92.0 /100 | #98 | Exceptional 5.2% |
| Cubans | 91.8 /100 | #99 | Exceptional 5.2% |
| Immigrants | Greece | 91.4 /100 | #100 | Exceptional 5.2% |
| Immigrants | Netherlands | 91.0 /100 | #101 | Exceptional 5.2% |
| Immigrants | Cuba | 90.9 /100 | #102 | Exceptional 5.2% |
| Sri Lankans | 90.3 /100 | #103 | Exceptional 5.2% |
| Immigrants | Switzerland | 90.1 /100 | #104 | Exceptional 5.2% |
| Immigrants | France | 90.0 /100 | #105 | Excellent 5.2% |
| Pakistanis | 89.9 /100 | #106 | Excellent 5.2% |
| Slavs | 89.8 /100 | #107 | Excellent 5.2% |
| Iranians | 89.7 /100 | #108 | Excellent 5.2% |
| Immigrants | Russia | 89.0 /100 | #109 | Excellent 5.2% |
| Immigrants | Czechoslovakia | 88.9 /100 | #110 | Excellent 5.2% |
| French Canadians | 88.9 /100 | #111 | Excellent 5.2% |