Honduran vs Panamanian Householder Income Under 25 years
COMPARE
Honduran
Panamanian
Householder Income Under 25 years
Householder Income Under 25 years Comparison
Hondurans
Panamanians
$48,885
HOUSEHOLDER INCOME UNDER 25 YEARS
0.0/ 100
METRIC RATING
289th/ 347
METRIC RANK
$51,611
HOUSEHOLDER INCOME UNDER 25 YEARS
19.5/ 100
METRIC RATING
191st/ 347
METRIC RANK
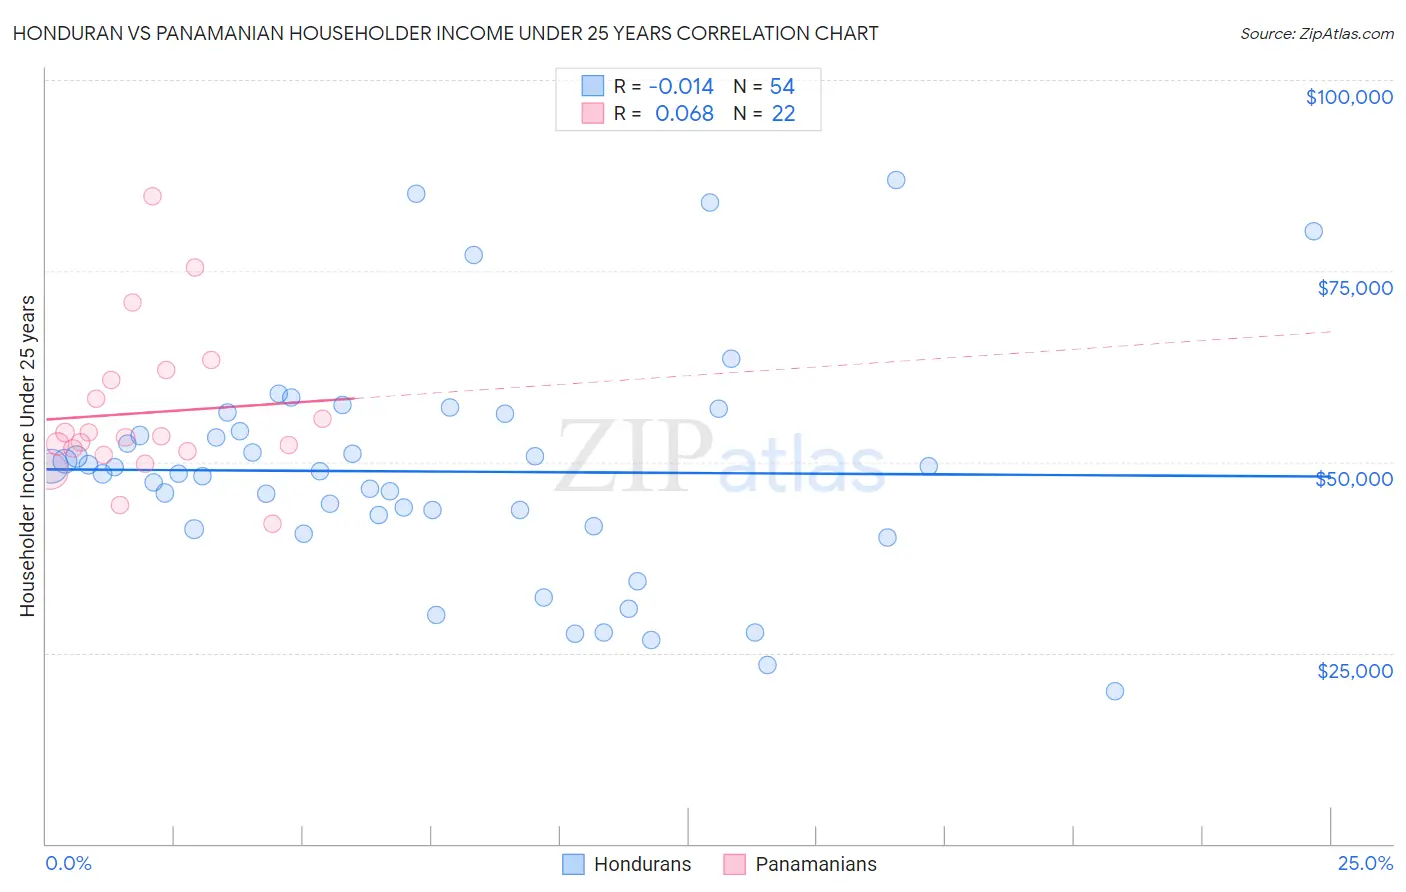
Honduran vs Panamanian Householder Income Under 25 years Correlation Chart
The statistical analysis conducted on geographies consisting of 310,566,711 people shows no correlation between the proportion of Hondurans and household income with householder under the age of 25 in the United States with a correlation coefficient (R) of -0.014 and weighted average of $48,885. Similarly, the statistical analysis conducted on geographies consisting of 249,167,453 people shows a slight positive correlation between the proportion of Panamanians and household income with householder under the age of 25 in the United States with a correlation coefficient (R) of 0.068 and weighted average of $51,611, a difference of 5.6%.
Householder Income Under 25 years Correlation Summary
| Measurement | Honduran | Panamanian |
| Minimum | $19,963 | $41,875 |
| Maximum | $86,950 | $84,853 |
| Range | $66,987 | $42,978 |
| Mean | $48,732 | $56,431 |
| Median | $48,619 | $53,276 |
| Interquartile 25% (IQ1) | $41,617 | $51,350 |
| Interquartile 75% (IQ3) | $53,996 | $60,790 |
| Interquartile Range (IQR) | $12,378 | $9,440 |
| Standard Deviation (Sample) | $14,744 | $10,018 |
| Standard Deviation (Population) | $14,607 | $9,787 |
Similar Demographics by Householder Income Under 25 years
Demographics Similar to Hondurans by Householder Income Under 25 years
In terms of householder income under 25 years, the demographic groups most similar to Hondurans are American ($48,860, a difference of 0.050%), Liberian ($48,917, a difference of 0.060%), Senegalese ($48,953, a difference of 0.14%), French American Indian ($48,977, a difference of 0.19%), and Immigrants from Burma/Myanmar ($48,749, a difference of 0.28%).
| Demographics | Rating | Rank | Householder Income Under 25 years |
| Alsatians | 0.1 /100 | #282 | Tragic $49,267 |
| Immigrants | Nigeria | 0.1 /100 | #283 | Tragic $49,174 |
| Carpatho Rusyns | 0.1 /100 | #284 | Tragic $49,113 |
| Scotch-Irish | 0.0 /100 | #285 | Tragic $49,039 |
| French American Indians | 0.0 /100 | #286 | Tragic $48,977 |
| Senegalese | 0.0 /100 | #287 | Tragic $48,953 |
| Liberians | 0.0 /100 | #288 | Tragic $48,917 |
| Hondurans | 0.0 /100 | #289 | Tragic $48,885 |
| Americans | 0.0 /100 | #290 | Tragic $48,860 |
| Immigrants | Burma/Myanmar | 0.0 /100 | #291 | Tragic $48,749 |
| Shoshone | 0.0 /100 | #292 | Tragic $48,720 |
| Sub-Saharan Africans | 0.0 /100 | #293 | Tragic $48,691 |
| Somalis | 0.0 /100 | #294 | Tragic $48,657 |
| Central American Indians | 0.0 /100 | #295 | Tragic $48,643 |
| Blackfeet | 0.0 /100 | #296 | Tragic $48,603 |
Demographics Similar to Panamanians by Householder Income Under 25 years
In terms of householder income under 25 years, the demographic groups most similar to Panamanians are Malaysian ($51,615, a difference of 0.010%), West Indian ($51,583, a difference of 0.060%), Immigrants from Eritrea ($51,574, a difference of 0.070%), Croatian ($51,662, a difference of 0.10%), and Northern European ($51,678, a difference of 0.13%).
| Demographics | Rating | Rank | Householder Income Under 25 years |
| Paiute | 25.1 /100 | #184 | Fair $51,743 |
| Immigrants | Latvia | 24.8 /100 | #185 | Fair $51,737 |
| Alaskan Athabascans | 23.8 /100 | #186 | Fair $51,713 |
| Immigrants | South Africa | 23.4 /100 | #187 | Fair $51,705 |
| Northern Europeans | 22.2 /100 | #188 | Fair $51,678 |
| Croatians | 21.6 /100 | #189 | Fair $51,662 |
| Malaysians | 19.7 /100 | #190 | Poor $51,615 |
| Panamanians | 19.5 /100 | #191 | Poor $51,611 |
| West Indians | 18.5 /100 | #192 | Poor $51,583 |
| Immigrants | Eritrea | 18.1 /100 | #193 | Poor $51,574 |
| Guatemalans | 16.4 /100 | #194 | Poor $51,525 |
| Estonians | 16.4 /100 | #195 | Poor $51,523 |
| Palestinians | 16.1 /100 | #196 | Poor $51,515 |
| Pima | 15.7 /100 | #197 | Poor $51,503 |
| Immigrants | Syria | 15.4 /100 | #198 | Poor $51,494 |