Honduran vs Immigrants from Lebanon Doctorate Degree
COMPARE
Honduran
Immigrants from Lebanon
Doctorate Degree
Doctorate Degree Comparison
Hondurans
Immigrants from Lebanon
1.4%
DOCTORATE DEGREE
0.1/ 100
METRIC RATING
301st/ 347
METRIC RANK
2.2%
DOCTORATE DEGREE
99.8/ 100
METRIC RATING
77th/ 347
METRIC RANK
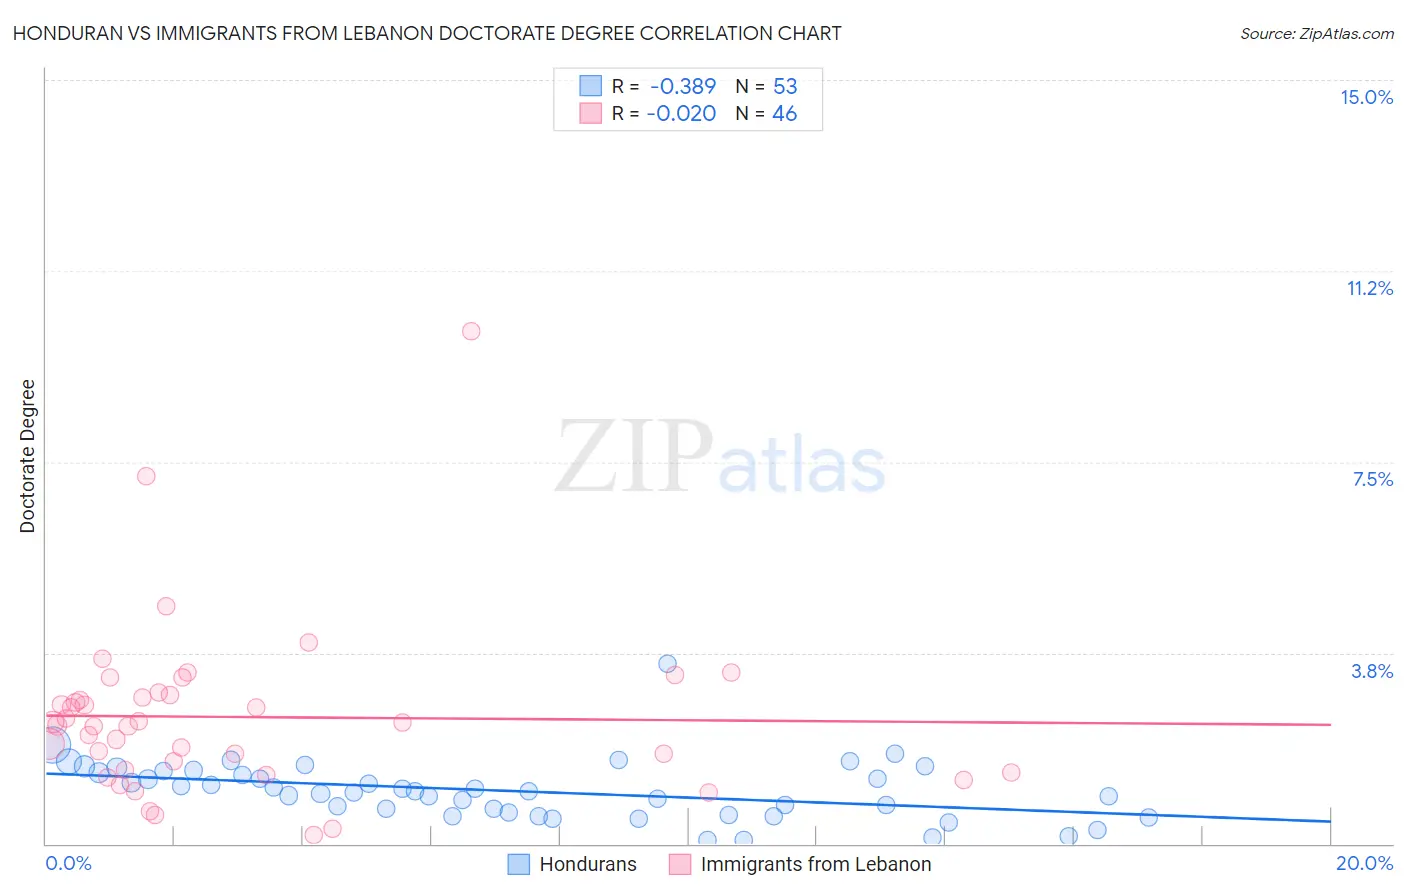
Honduran vs Immigrants from Lebanon Doctorate Degree Correlation Chart
The statistical analysis conducted on geographies consisting of 353,493,609 people shows a mild negative correlation between the proportion of Hondurans and percentage of population with at least doctorate degree education in the United States with a correlation coefficient (R) of -0.389 and weighted average of 1.4%. Similarly, the statistical analysis conducted on geographies consisting of 216,746,236 people shows no correlation between the proportion of Immigrants from Lebanon and percentage of population with at least doctorate degree education in the United States with a correlation coefficient (R) of -0.020 and weighted average of 2.2%, a difference of 61.8%.
Doctorate Degree Correlation Summary
| Measurement | Honduran | Immigrants from Lebanon |
| Minimum | 0.068% | 0.17% |
| Maximum | 3.5% | 10.1% |
| Range | 3.5% | 9.9% |
| Mean | 1.0% | 2.5% |
| Median | 1.0% | 2.4% |
| Interquartile 25% (IQ1) | 0.59% | 1.4% |
| Interquartile 75% (IQ3) | 1.4% | 2.9% |
| Interquartile Range (IQR) | 0.82% | 1.5% |
| Standard Deviation (Sample) | 0.59% | 1.7% |
| Standard Deviation (Population) | 0.58% | 1.7% |
Similar Demographics by Doctorate Degree
Demographics Similar to Hondurans by Doctorate Degree
In terms of doctorate degree, the demographic groups most similar to Hondurans are Immigrants from Guatemala (1.4%, a difference of 0.070%), Shoshone (1.4%, a difference of 0.33%), Immigrants from Dominica (1.4%, a difference of 0.36%), Belizean (1.4%, a difference of 0.40%), and Mexican American Indian (1.4%, a difference of 0.42%).
| Demographics | Rating | Rank | Doctorate Degree |
| Samoans | 0.2 /100 | #294 | Tragic 1.4% |
| Guatemalans | 0.2 /100 | #295 | Tragic 1.4% |
| Immigrants | Ecuador | 0.2 /100 | #296 | Tragic 1.4% |
| Tsimshian | 0.2 /100 | #297 | Tragic 1.4% |
| Puerto Ricans | 0.1 /100 | #298 | Tragic 1.4% |
| Belizeans | 0.1 /100 | #299 | Tragic 1.4% |
| Immigrants | Guatemala | 0.1 /100 | #300 | Tragic 1.4% |
| Hondurans | 0.1 /100 | #301 | Tragic 1.4% |
| Shoshone | 0.1 /100 | #302 | Tragic 1.4% |
| Immigrants | Dominica | 0.1 /100 | #303 | Tragic 1.4% |
| Mexican American Indians | 0.1 /100 | #304 | Tragic 1.4% |
| Pennsylvania Germans | 0.1 /100 | #305 | Tragic 1.4% |
| Guyanese | 0.1 /100 | #306 | Tragic 1.4% |
| Cubans | 0.1 /100 | #307 | Tragic 1.4% |
| Immigrants | Laos | 0.1 /100 | #308 | Tragic 1.4% |
Demographics Similar to Immigrants from Lebanon by Doctorate Degree
In terms of doctorate degree, the demographic groups most similar to Immigrants from Lebanon are Immigrants from Hungary (2.2%, a difference of 0.010%), Immigrants from Western Asia (2.2%, a difference of 0.080%), Immigrants from North America (2.2%, a difference of 0.18%), Immigrants from Bulgaria (2.3%, a difference of 0.32%), and Immigrants from Canada (2.3%, a difference of 0.40%).
| Demographics | Rating | Rank | Doctorate Degree |
| Lithuanians | 99.8 /100 | #70 | Exceptional 2.3% |
| Immigrants | Bolivia | 99.8 /100 | #71 | Exceptional 2.3% |
| Immigrants | Canada | 99.8 /100 | #72 | Exceptional 2.3% |
| Immigrants | Bulgaria | 99.8 /100 | #73 | Exceptional 2.3% |
| Immigrants | North America | 99.8 /100 | #74 | Exceptional 2.2% |
| Immigrants | Western Asia | 99.8 /100 | #75 | Exceptional 2.2% |
| Immigrants | Hungary | 99.8 /100 | #76 | Exceptional 2.2% |
| Immigrants | Lebanon | 99.8 /100 | #77 | Exceptional 2.2% |
| Immigrants | Belarus | 99.7 /100 | #78 | Exceptional 2.2% |
| Northern Europeans | 99.7 /100 | #79 | Exceptional 2.2% |
| Ugandans | 99.7 /100 | #80 | Exceptional 2.2% |
| Immigrants | Argentina | 99.7 /100 | #81 | Exceptional 2.2% |
| Immigrants | Uganda | 99.6 /100 | #82 | Exceptional 2.2% |
| Immigrants | Lithuania | 99.6 /100 | #83 | Exceptional 2.2% |
| Immigrants | England | 99.6 /100 | #84 | Exceptional 2.2% |