Hmong vs Eastern European Male Unemployment
COMPARE
Hmong
Eastern European
Male Unemployment
Male Unemployment Comparison
Hmong
Eastern Europeans
5.5%
MALE UNEMPLOYMENT
7.0/ 100
METRIC RATING
212th/ 347
METRIC RANK
5.0%
MALE UNEMPLOYMENT
97.9/ 100
METRIC RATING
63rd/ 347
METRIC RANK
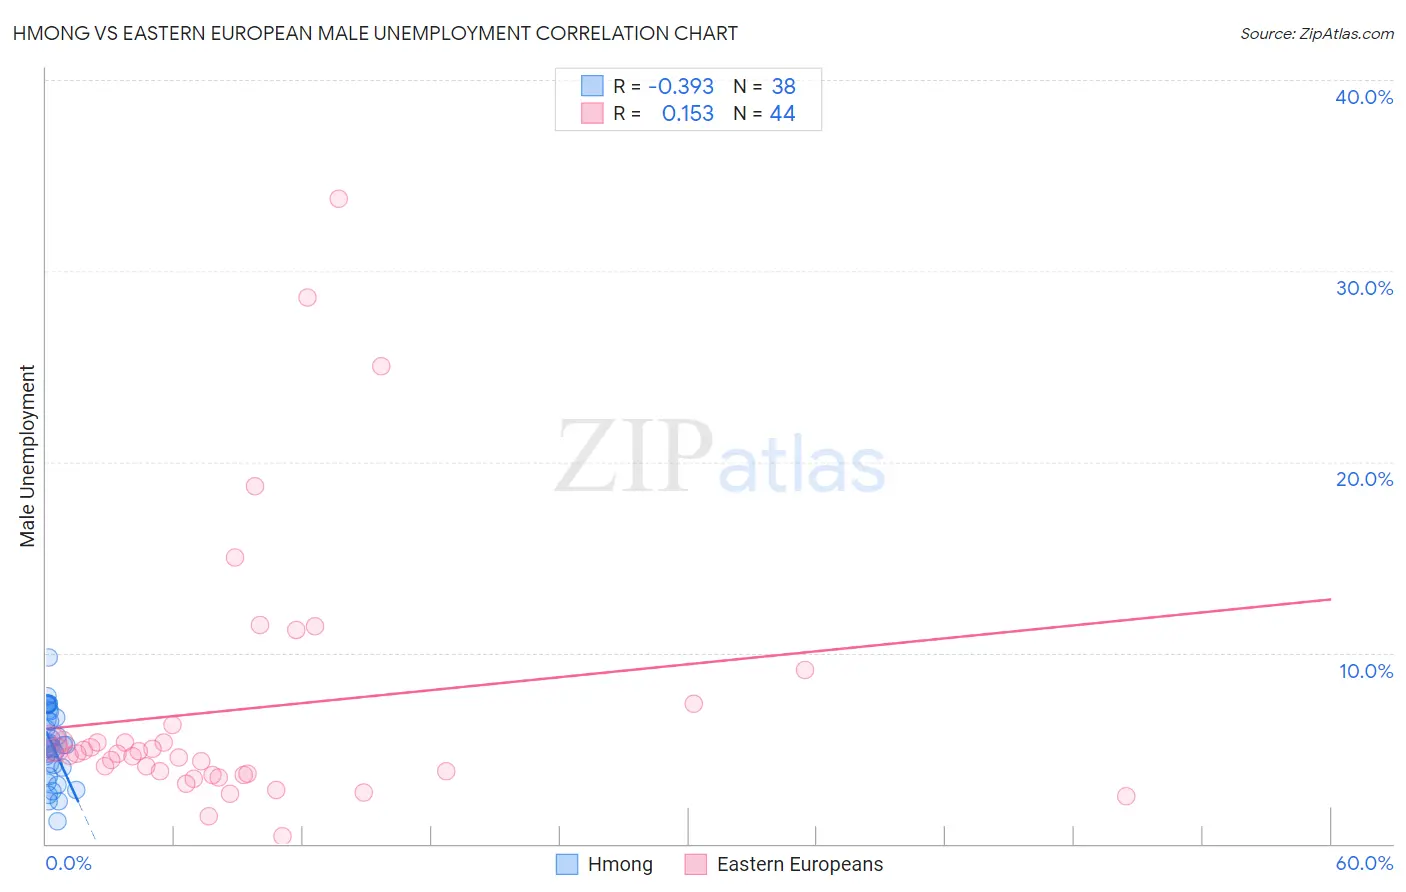
Hmong vs Eastern European Male Unemployment Correlation Chart
The statistical analysis conducted on geographies consisting of 24,680,008 people shows a mild negative correlation between the proportion of Hmong and unemployment rate among males in the United States with a correlation coefficient (R) of -0.393 and weighted average of 5.5%. Similarly, the statistical analysis conducted on geographies consisting of 457,878,512 people shows a poor positive correlation between the proportion of Eastern Europeans and unemployment rate among males in the United States with a correlation coefficient (R) of 0.153 and weighted average of 5.0%, a difference of 9.9%.
Male Unemployment Correlation Summary
| Measurement | Hmong | Eastern European |
| Minimum | 1.2% | 0.41% |
| Maximum | 9.8% | 33.8% |
| Range | 8.6% | 33.4% |
| Mean | 5.2% | 7.0% |
| Median | 5.2% | 4.7% |
| Interquartile 25% (IQ1) | 4.0% | 3.6% |
| Interquartile 75% (IQ3) | 7.0% | 5.8% |
| Interquartile Range (IQR) | 3.0% | 2.2% |
| Standard Deviation (Sample) | 1.9% | 7.0% |
| Standard Deviation (Population) | 1.9% | 6.9% |
Similar Demographics by Male Unemployment
Demographics Similar to Hmong by Male Unemployment
In terms of male unemployment, the demographic groups most similar to Hmong are Israeli (5.5%, a difference of 0.090%), South American Indian (5.5%, a difference of 0.14%), Ugandan (5.5%, a difference of 0.16%), Immigrants from Middle Africa (5.5%, a difference of 0.27%), and Immigrants from Lebanon (5.5%, a difference of 0.32%).
| Demographics | Rating | Rank | Male Unemployment |
| Immigrants | Costa Rica | 11.4 /100 | #205 | Poor 5.5% |
| Immigrants | Ukraine | 9.9 /100 | #206 | Tragic 5.5% |
| Immigrants | Syria | 9.3 /100 | #207 | Tragic 5.5% |
| Immigrants | Lebanon | 8.6 /100 | #208 | Tragic 5.5% |
| Immigrants | Middle Africa | 8.3 /100 | #209 | Tragic 5.5% |
| South American Indians | 7.6 /100 | #210 | Tragic 5.5% |
| Israelis | 7.4 /100 | #211 | Tragic 5.5% |
| Hmong | 7.0 /100 | #212 | Tragic 5.5% |
| Ugandans | 6.3 /100 | #213 | Tragic 5.5% |
| Puget Sound Salish | 5.6 /100 | #214 | Tragic 5.5% |
| Samoans | 4.9 /100 | #215 | Tragic 5.5% |
| Immigrants | Immigrants | 4.3 /100 | #216 | Tragic 5.5% |
| Delaware | 4.2 /100 | #217 | Tragic 5.5% |
| Immigrants | Albania | 3.6 /100 | #218 | Tragic 5.5% |
| Immigrants | Western Asia | 3.5 /100 | #219 | Tragic 5.6% |
Demographics Similar to Eastern Europeans by Male Unemployment
In terms of male unemployment, the demographic groups most similar to Eastern Europeans are Basque (5.0%, a difference of 0.010%), Celtic (5.0%, a difference of 0.020%), Cambodian (5.0%, a difference of 0.14%), Icelander (5.0%, a difference of 0.18%), and Immigrants from Argentina (5.0%, a difference of 0.22%).
| Demographics | Rating | Rank | Male Unemployment |
| Immigrants | Bulgaria | 98.7 /100 | #56 | Exceptional 5.0% |
| Turks | 98.5 /100 | #57 | Exceptional 5.0% |
| Lithuanians | 98.5 /100 | #58 | Exceptional 5.0% |
| Immigrants | Netherlands | 98.3 /100 | #59 | Exceptional 5.0% |
| Immigrants | Argentina | 98.1 /100 | #60 | Exceptional 5.0% |
| Cambodians | 98.1 /100 | #61 | Exceptional 5.0% |
| Basques | 97.9 /100 | #62 | Exceptional 5.0% |
| Eastern Europeans | 97.9 /100 | #63 | Exceptional 5.0% |
| Celtics | 97.8 /100 | #64 | Exceptional 5.0% |
| Icelanders | 97.6 /100 | #65 | Exceptional 5.0% |
| Finns | 97.5 /100 | #66 | Exceptional 5.0% |
| Immigrants | Canada | 97.5 /100 | #67 | Exceptional 5.0% |
| Australians | 97.4 /100 | #68 | Exceptional 5.0% |
| Immigrants | Sweden | 97.4 /100 | #69 | Exceptional 5.0% |
| Whites/Caucasians | 97.3 /100 | #70 | Exceptional 5.0% |