Hmong vs Cheyenne Unemployment Among Women with Children Ages 6 to 17 years
COMPARE
Hmong
Cheyenne
Unemployment Among Women with Children Ages 6 to 17 years
Unemployment Among Women with Children Ages 6 to 17 years Comparison
Hmong
Cheyenne
8.7%
UNEMPLOYMENT AMONG WOMEN WITH CHILDREN AGES 6 TO 17 YEARS
94.3/ 100
METRIC RATING
128th/ 347
METRIC RANK
16.4%
UNEMPLOYMENT AMONG WOMEN WITH CHILDREN AGES 6 TO 17 YEARS
0.0/ 100
METRIC RATING
344th/ 347
METRIC RANK
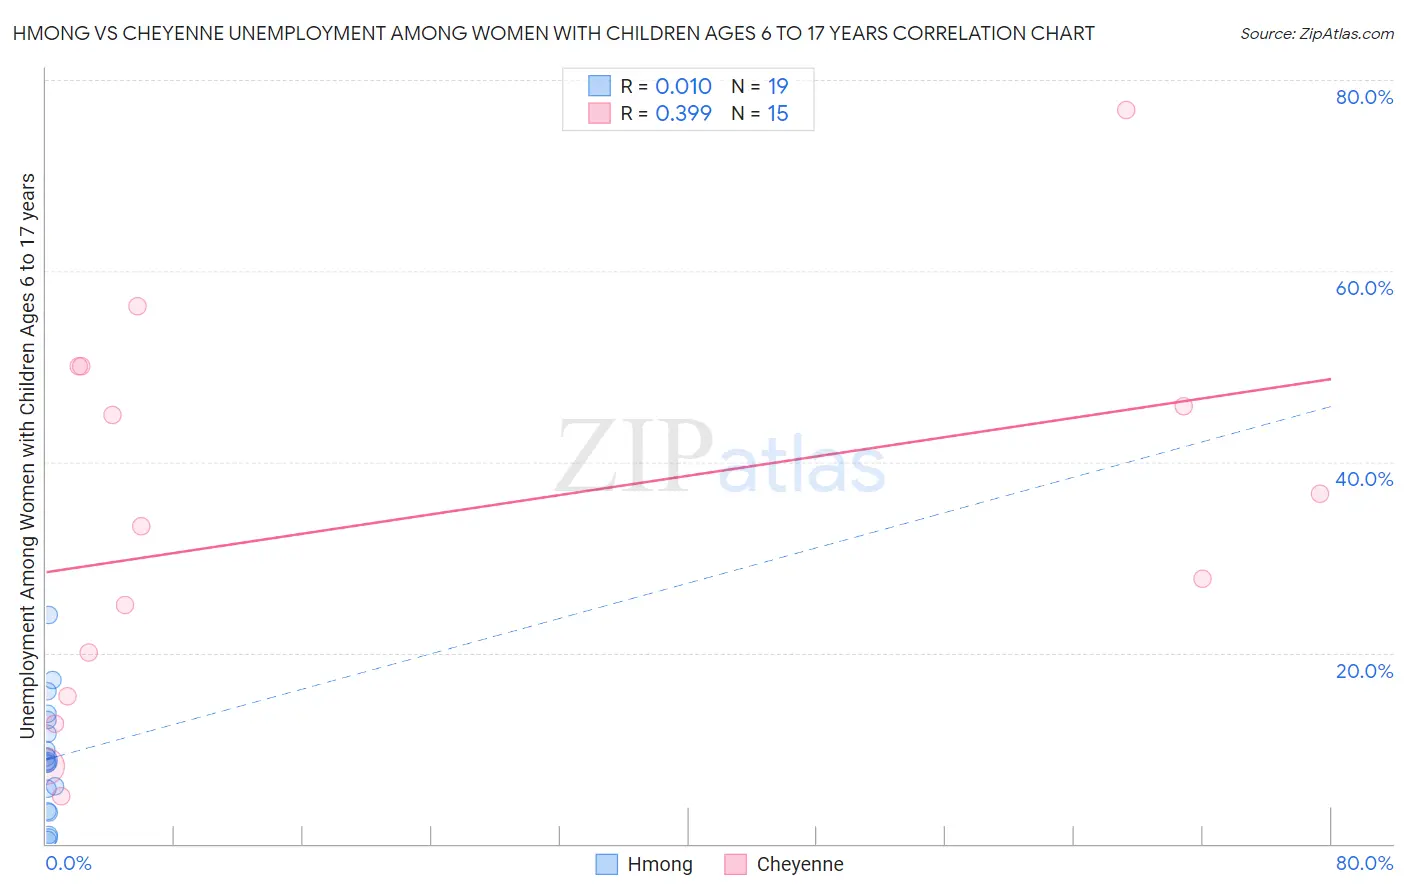
Hmong vs Cheyenne Unemployment Among Women with Children Ages 6 to 17 years Correlation Chart
The statistical analysis conducted on geographies consisting of 23,659,268 people shows no correlation between the proportion of Hmong and unemployment rate among women with children between the ages 6 and 17 in the United States with a correlation coefficient (R) of 0.010 and weighted average of 8.7%. Similarly, the statistical analysis conducted on geographies consisting of 72,086,301 people shows a mild positive correlation between the proportion of Cheyenne and unemployment rate among women with children between the ages 6 and 17 in the United States with a correlation coefficient (R) of 0.399 and weighted average of 16.4%, a difference of 88.6%.
Unemployment Among Women with Children Ages 6 to 17 years Correlation Summary
| Measurement | Hmong | Cheyenne |
| Minimum | 0.40% | 5.0% |
| Maximum | 24.0% | 76.9% |
| Range | 23.6% | 71.9% |
| Mean | 8.9% | 33.8% |
| Median | 8.6% | 33.3% |
| Interquartile 25% (IQ1) | 3.4% | 15.4% |
| Interquartile 75% (IQ3) | 13.0% | 50.0% |
| Interquartile Range (IQR) | 9.6% | 34.6% |
| Standard Deviation (Sample) | 6.1% | 20.3% |
| Standard Deviation (Population) | 6.0% | 19.6% |
Similar Demographics by Unemployment Among Women with Children Ages 6 to 17 years
Demographics Similar to Hmong by Unemployment Among Women with Children Ages 6 to 17 years
In terms of unemployment among women with children ages 6 to 17 years, the demographic groups most similar to Hmong are Czech (8.7%, a difference of 0.020%), Immigrants from Northern Africa (8.7%, a difference of 0.030%), South African (8.7%, a difference of 0.050%), Barbadian (8.7%, a difference of 0.10%), and Immigrants from Morocco (8.7%, a difference of 0.12%).
| Demographics | Rating | Rank | Unemployment Among Women with Children Ages 6 to 17 years |
| Immigrants | Denmark | 95.5 /100 | #121 | Exceptional 8.7% |
| Immigrants | Egypt | 95.0 /100 | #122 | Exceptional 8.7% |
| Immigrants | Morocco | 94.9 /100 | #123 | Exceptional 8.7% |
| Immigrants | Lebanon | 94.9 /100 | #124 | Exceptional 8.7% |
| South Africans | 94.6 /100 | #125 | Exceptional 8.7% |
| Immigrants | Northern Africa | 94.4 /100 | #126 | Exceptional 8.7% |
| Czechs | 94.4 /100 | #127 | Exceptional 8.7% |
| Hmong | 94.3 /100 | #128 | Exceptional 8.7% |
| Barbadians | 93.8 /100 | #129 | Exceptional 8.7% |
| Immigrants | Western Asia | 93.1 /100 | #130 | Exceptional 8.7% |
| Slavs | 92.2 /100 | #131 | Exceptional 8.7% |
| Yaqui | 92.2 /100 | #132 | Exceptional 8.7% |
| Egyptians | 91.8 /100 | #133 | Exceptional 8.7% |
| Immigrants | Ireland | 91.0 /100 | #134 | Exceptional 8.7% |
| Europeans | 90.6 /100 | #135 | Exceptional 8.7% |
Demographics Similar to Cheyenne by Unemployment Among Women with Children Ages 6 to 17 years
In terms of unemployment among women with children ages 6 to 17 years, the demographic groups most similar to Cheyenne are Arapaho (16.8%, a difference of 2.9%), Inupiat (14.9%, a difference of 10.3%), Yuman (14.8%, a difference of 10.6%), Yup'ik (18.6%, a difference of 13.6%), and Pima (18.9%, a difference of 15.2%).
| Demographics | Rating | Rank | Unemployment Among Women with Children Ages 6 to 17 years |
| Natives/Alaskans | 0.0 /100 | #333 | Tragic 11.5% |
| Ugandans | 0.0 /100 | #334 | Tragic 12.0% |
| Colville | 0.0 /100 | #335 | Tragic 12.3% |
| Houma | 0.0 /100 | #336 | Tragic 12.5% |
| Immigrants | Yemen | 0.0 /100 | #337 | Tragic 12.7% |
| Hopi | 0.0 /100 | #338 | Tragic 12.9% |
| Sioux | 0.0 /100 | #339 | Tragic 13.2% |
| Puerto Ricans | 0.0 /100 | #340 | Tragic 13.9% |
| Navajo | 0.0 /100 | #341 | Tragic 14.2% |
| Yuman | 0.0 /100 | #342 | Tragic 14.8% |
| Inupiat | 0.0 /100 | #343 | Tragic 14.9% |
| Cheyenne | 0.0 /100 | #344 | Tragic 16.4% |
| Arapaho | 0.0 /100 | #345 | Tragic 16.8% |
| Yup'ik | 0.0 /100 | #346 | Tragic 18.6% |
| Pima | 0.0 /100 | #347 | Tragic 18.9% |