Hmong vs Cheyenne Disability Age 35 to 64
COMPARE
Hmong
Cheyenne
Disability Age 35 to 64
Disability Age 35 to 64 Comparison
Hmong
Cheyenne
13.1%
DISABILITY AGE 35 TO 64
0.0/ 100
METRIC RATING
286th/ 347
METRIC RANK
13.6%
DISABILITY AGE 35 TO 64
0.0/ 100
METRIC RATING
298th/ 347
METRIC RANK
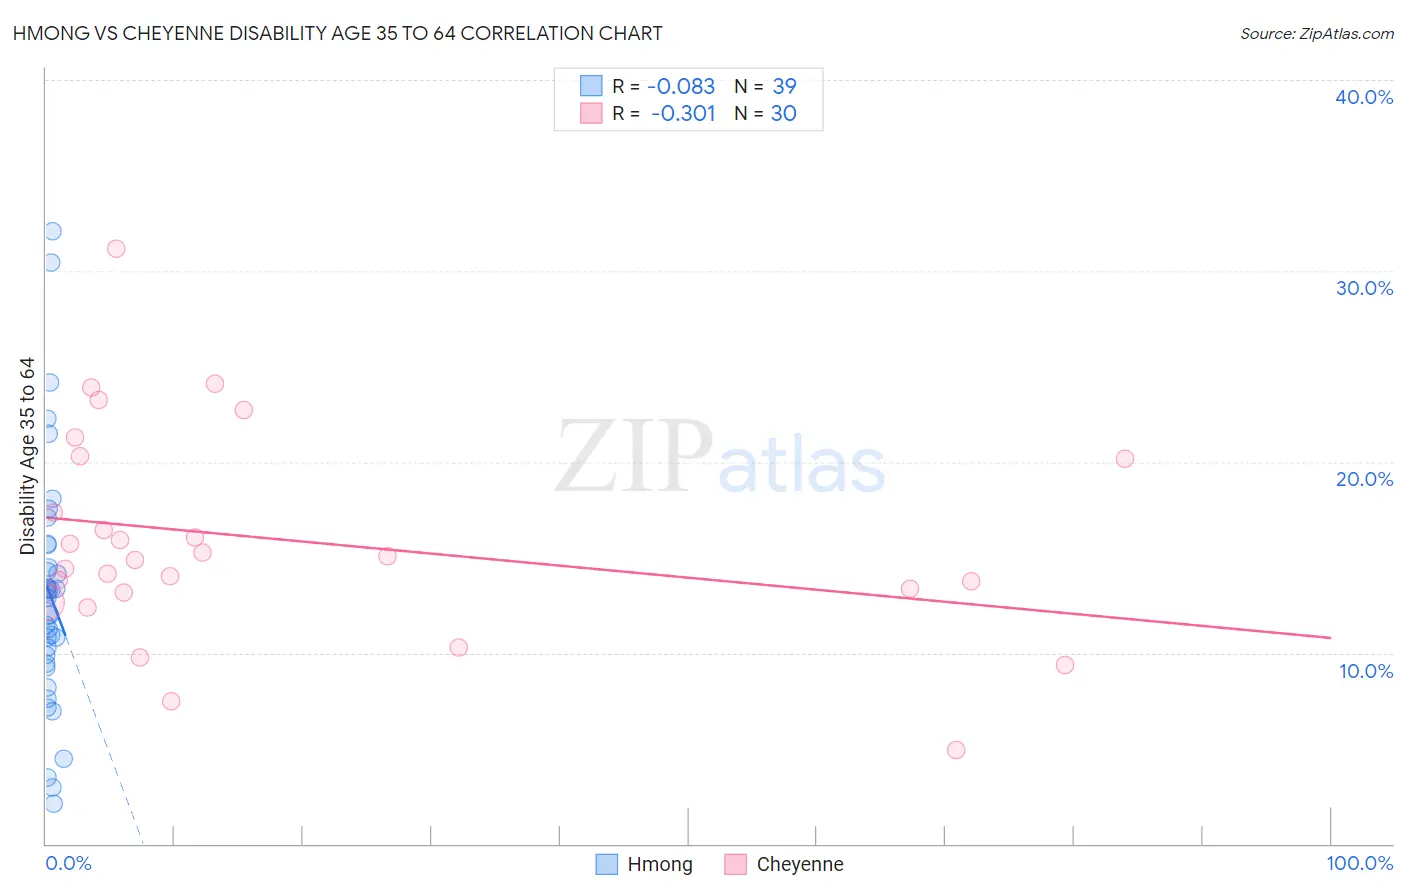
Hmong vs Cheyenne Disability Age 35 to 64 Correlation Chart
The statistical analysis conducted on geographies consisting of 24,678,157 people shows a slight negative correlation between the proportion of Hmong and percentage of population with a disability between the ages 34 and 64 in the United States with a correlation coefficient (R) of -0.083 and weighted average of 13.1%. Similarly, the statistical analysis conducted on geographies consisting of 80,703,437 people shows a mild negative correlation between the proportion of Cheyenne and percentage of population with a disability between the ages 34 and 64 in the United States with a correlation coefficient (R) of -0.301 and weighted average of 13.6%, a difference of 3.7%.
Disability Age 35 to 64 Correlation Summary
| Measurement | Hmong | Cheyenne |
| Minimum | 2.1% | 4.9% |
| Maximum | 32.0% | 31.1% |
| Range | 29.9% | 26.3% |
| Mean | 13.1% | 15.9% |
| Median | 12.9% | 15.0% |
| Interquartile 25% (IQ1) | 9.4% | 13.1% |
| Interquartile 75% (IQ3) | 15.6% | 20.2% |
| Interquartile Range (IQR) | 6.2% | 7.0% |
| Standard Deviation (Sample) | 6.5% | 5.6% |
| Standard Deviation (Population) | 6.4% | 5.5% |
Demographics Similar to Hmong and Cheyenne by Disability Age 35 to 64
In terms of disability age 35 to 64, the demographic groups most similar to Hmong are Tlingit-Haida (13.2%, a difference of 0.27%), Immigrants from Somalia (13.1%, a difference of 0.31%), Fijian (13.2%, a difference of 0.62%), Indonesian (13.2%, a difference of 0.69%), and Nonimmigrants (13.0%, a difference of 0.75%). Similarly, the demographic groups most similar to Cheyenne are Bangladeshi (13.6%, a difference of 0.030%), Spanish American (13.7%, a difference of 0.20%), Delaware (13.7%, a difference of 0.28%), African (13.6%, a difference of 0.38%), and French American Indian (13.7%, a difference of 0.58%).
| Demographics | Rating | Rank | Disability Age 35 to 64 |
| Immigrants | Laos | 0.1 /100 | #282 | Tragic 13.0% |
| Central American Indians | 0.0 /100 | #283 | Tragic 13.0% |
| Immigrants | Nonimmigrants | 0.0 /100 | #284 | Tragic 13.0% |
| Immigrants | Somalia | 0.0 /100 | #285 | Tragic 13.1% |
| Hmong | 0.0 /100 | #286 | Tragic 13.1% |
| Tlingit-Haida | 0.0 /100 | #287 | Tragic 13.2% |
| Fijians | 0.0 /100 | #288 | Tragic 13.2% |
| Indonesians | 0.0 /100 | #289 | Tragic 13.2% |
| Immigrants | Liberia | 0.0 /100 | #290 | Tragic 13.2% |
| Immigrants | Congo | 0.0 /100 | #291 | Tragic 13.3% |
| Puget Sound Salish | 0.0 /100 | #292 | Tragic 13.3% |
| Ute | 0.0 /100 | #293 | Tragic 13.4% |
| Yaqui | 0.0 /100 | #294 | Tragic 13.5% |
| Yakama | 0.0 /100 | #295 | Tragic 13.6% |
| Africans | 0.0 /100 | #296 | Tragic 13.6% |
| Bangladeshis | 0.0 /100 | #297 | Tragic 13.6% |
| Cheyenne | 0.0 /100 | #298 | Tragic 13.6% |
| Spanish Americans | 0.0 /100 | #299 | Tragic 13.7% |
| Delaware | 0.0 /100 | #300 | Tragic 13.7% |
| French American Indians | 0.0 /100 | #301 | Tragic 13.7% |
| Aleuts | 0.0 /100 | #302 | Tragic 13.8% |