Hawaiian vs Marshallese Unemployment Among Women with Children Ages 6 to 17 years
COMPARE
Hawaiian
Marshallese
Unemployment Among Women with Children Ages 6 to 17 years
Unemployment Among Women with Children Ages 6 to 17 years Comparison
Hawaiians
Marshallese
8.1%
UNEMPLOYMENT AMONG WOMEN WITH CHILDREN AGES 6 TO 17 YEARS
100.0/ 100
METRIC RATING
50th/ 347
METRIC RANK
8.3%
UNEMPLOYMENT AMONG WOMEN WITH CHILDREN AGES 6 TO 17 YEARS
99.9/ 100
METRIC RATING
68th/ 347
METRIC RANK
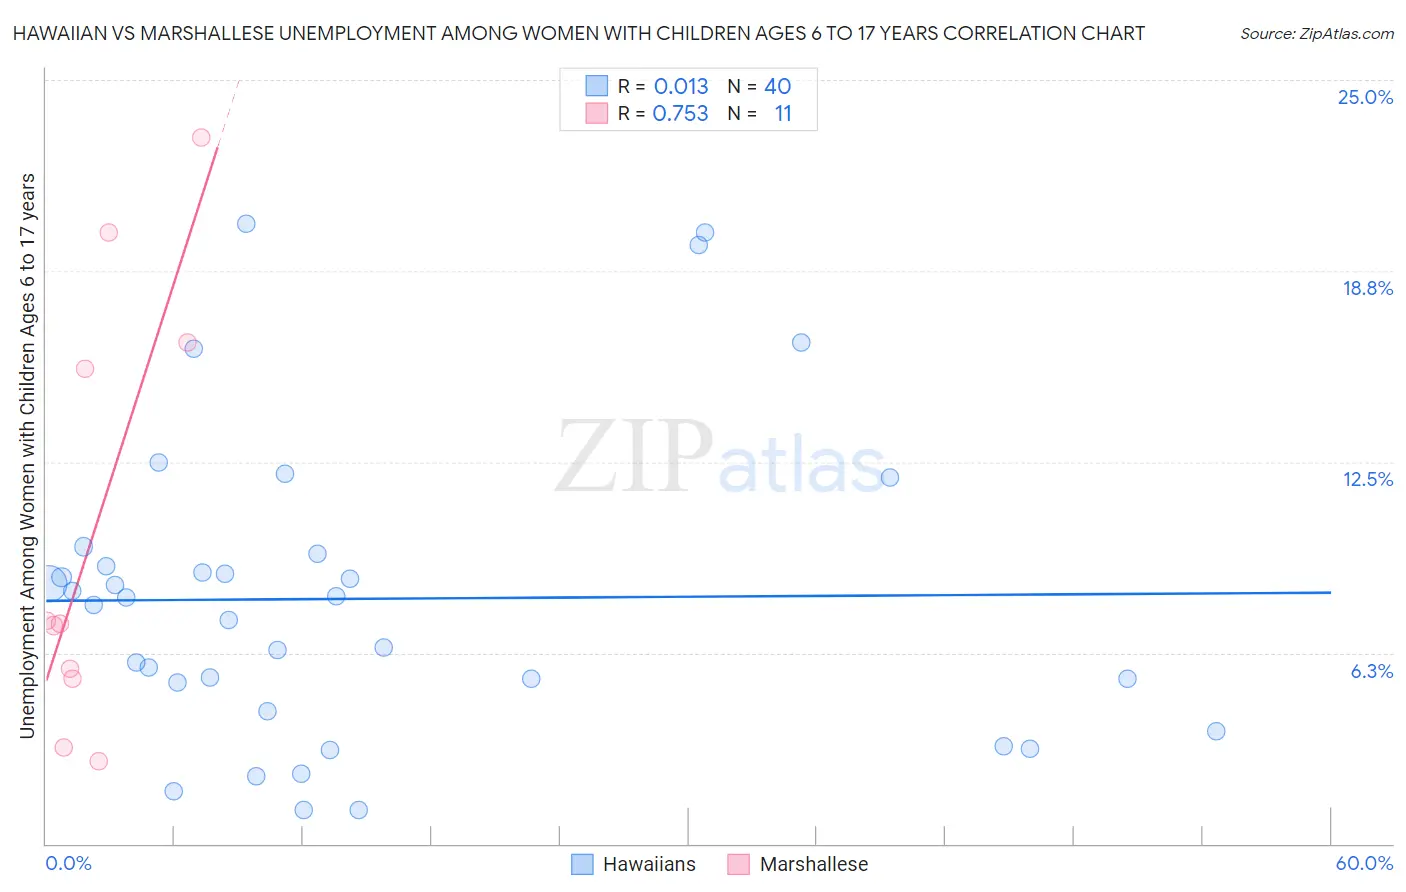
Hawaiian vs Marshallese Unemployment Among Women with Children Ages 6 to 17 years Correlation Chart
The statistical analysis conducted on geographies consisting of 248,677,596 people shows no correlation between the proportion of Hawaiians and unemployment rate among women with children between the ages 6 and 17 in the United States with a correlation coefficient (R) of 0.013 and weighted average of 8.1%. Similarly, the statistical analysis conducted on geographies consisting of 13,266,761 people shows a strong positive correlation between the proportion of Marshallese and unemployment rate among women with children between the ages 6 and 17 in the United States with a correlation coefficient (R) of 0.753 and weighted average of 8.3%, a difference of 2.6%.
Unemployment Among Women with Children Ages 6 to 17 years Correlation Summary
| Measurement | Hawaiian | Marshallese |
| Minimum | 1.1% | 2.7% |
| Maximum | 20.3% | 23.1% |
| Range | 19.2% | 20.4% |
| Mean | 8.0% | 10.3% |
| Median | 7.9% | 7.2% |
| Interquartile 25% (IQ1) | 4.8% | 5.4% |
| Interquartile 75% (IQ3) | 9.3% | 16.4% |
| Interquartile Range (IQR) | 4.5% | 11.0% |
| Standard Deviation (Sample) | 5.0% | 7.1% |
| Standard Deviation (Population) | 4.9% | 6.8% |
Demographics Similar to Hawaiians and Marshallese by Unemployment Among Women with Children Ages 6 to 17 years
In terms of unemployment among women with children ages 6 to 17 years, the demographic groups most similar to Hawaiians are Immigrants from Oceania (8.1%, a difference of 0.11%), Immigrants from Sudan (8.1%, a difference of 0.18%), Immigrants from Iraq (8.1%, a difference of 0.48%), Danish (8.1%, a difference of 0.54%), and Immigrants from Armenia (8.2%, a difference of 0.77%). Similarly, the demographic groups most similar to Marshallese are Immigrants from Thailand (8.3%, a difference of 0.030%), Armenian (8.3%, a difference of 0.080%), Luxembourger (8.3%, a difference of 0.18%), Immigrants from Albania (8.3%, a difference of 0.32%), and Immigrants from Kuwait (8.3%, a difference of 0.41%).
| Demographics | Rating | Rank | Unemployment Among Women with Children Ages 6 to 17 years |
| Immigrants | Oceania | 100.0 /100 | #49 | Exceptional 8.1% |
| Hawaiians | 100.0 /100 | #50 | Exceptional 8.1% |
| Immigrants | Sudan | 100.0 /100 | #51 | Exceptional 8.1% |
| Immigrants | Iraq | 100.0 /100 | #52 | Exceptional 8.1% |
| Danes | 100.0 /100 | #53 | Exceptional 8.1% |
| Immigrants | Armenia | 100.0 /100 | #54 | Exceptional 8.2% |
| Immigrants | Japan | 100.0 /100 | #55 | Exceptional 8.2% |
| Immigrants | Bosnia and Herzegovina | 100.0 /100 | #56 | Exceptional 8.2% |
| Immigrants | Laos | 100.0 /100 | #57 | Exceptional 8.2% |
| Immigrants | Malaysia | 100.0 /100 | #58 | Exceptional 8.2% |
| Immigrants | Philippines | 100.0 /100 | #59 | Exceptional 8.2% |
| Basques | 100.0 /100 | #60 | Exceptional 8.2% |
| Koreans | 100.0 /100 | #61 | Exceptional 8.2% |
| Spanish American Indians | 100.0 /100 | #62 | Exceptional 8.2% |
| Immigrants | South Eastern Asia | 99.9 /100 | #63 | Exceptional 8.2% |
| Immigrants | Kuwait | 99.9 /100 | #64 | Exceptional 8.3% |
| Immigrants | Albania | 99.9 /100 | #65 | Exceptional 8.3% |
| Luxembourgers | 99.9 /100 | #66 | Exceptional 8.3% |
| Armenians | 99.9 /100 | #67 | Exceptional 8.3% |
| Marshallese | 99.9 /100 | #68 | Exceptional 8.3% |
| Immigrants | Thailand | 99.9 /100 | #69 | Exceptional 8.3% |