Mongolian vs Marshallese Unemployment Among Women with Children Ages 6 to 17 years
COMPARE
Mongolian
Marshallese
Unemployment Among Women with Children Ages 6 to 17 years
Unemployment Among Women with Children Ages 6 to 17 years Comparison
Mongolians
Marshallese
8.4%
UNEMPLOYMENT AMONG WOMEN WITH CHILDREN AGES 6 TO 17 YEARS
99.6/ 100
METRIC RATING
79th/ 347
METRIC RANK
8.3%
UNEMPLOYMENT AMONG WOMEN WITH CHILDREN AGES 6 TO 17 YEARS
99.9/ 100
METRIC RATING
68th/ 347
METRIC RANK
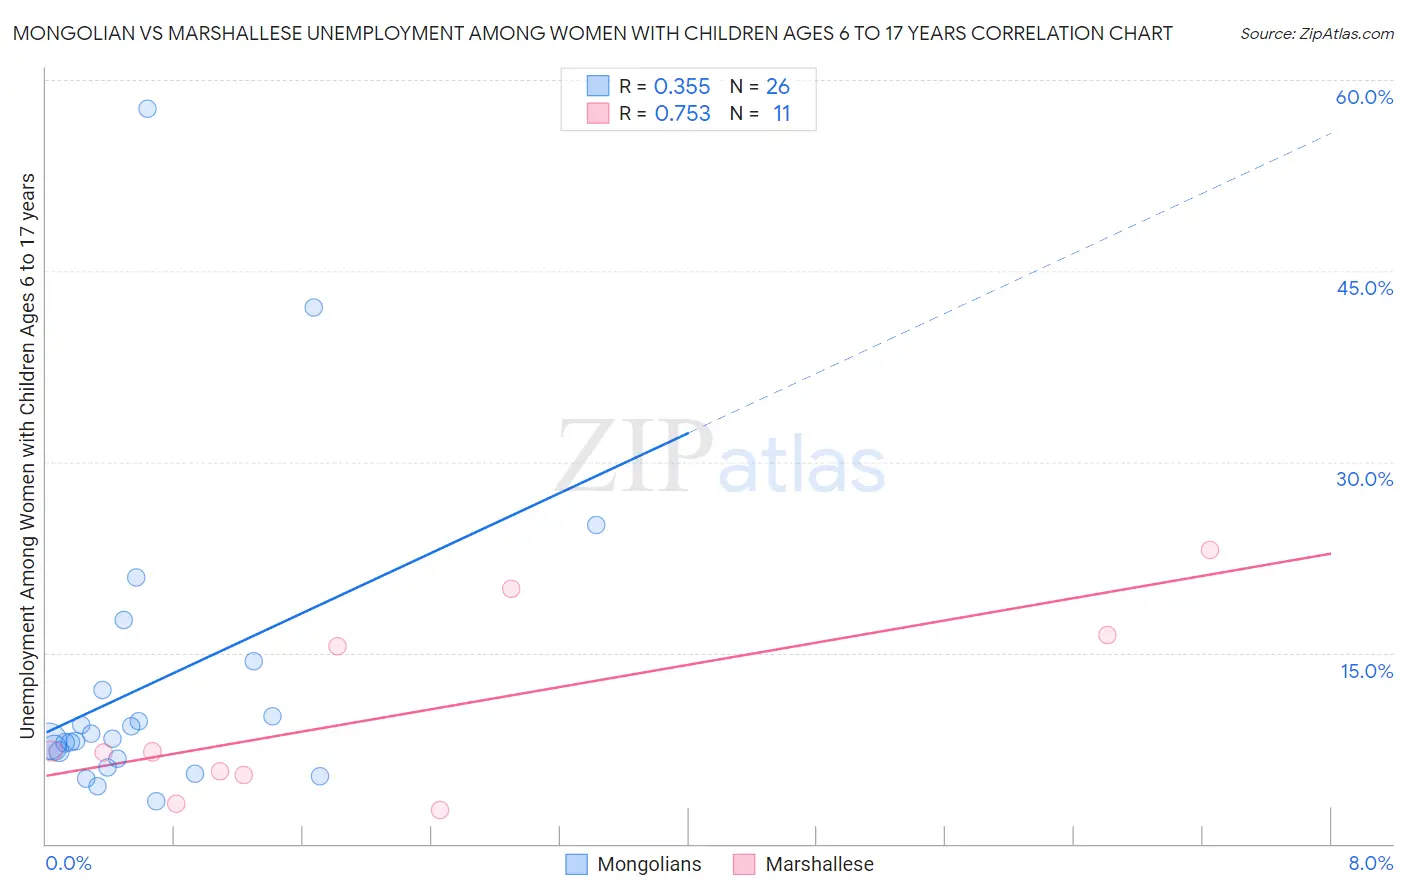
Mongolian vs Marshallese Unemployment Among Women with Children Ages 6 to 17 years Correlation Chart
The statistical analysis conducted on geographies consisting of 119,478,347 people shows a mild positive correlation between the proportion of Mongolians and unemployment rate among women with children between the ages 6 and 17 in the United States with a correlation coefficient (R) of 0.355 and weighted average of 8.4%. Similarly, the statistical analysis conducted on geographies consisting of 13,266,761 people shows a strong positive correlation between the proportion of Marshallese and unemployment rate among women with children between the ages 6 and 17 in the United States with a correlation coefficient (R) of 0.753 and weighted average of 8.3%, a difference of 1.3%.
Unemployment Among Women with Children Ages 6 to 17 years Correlation Summary
| Measurement | Mongolian | Marshallese |
| Minimum | 3.4% | 2.7% |
| Maximum | 57.7% | 23.1% |
| Range | 54.3% | 20.4% |
| Mean | 12.6% | 10.3% |
| Median | 8.2% | 7.2% |
| Interquartile 25% (IQ1) | 6.7% | 5.4% |
| Interquartile 75% (IQ3) | 12.1% | 16.4% |
| Interquartile Range (IQR) | 5.5% | 11.0% |
| Standard Deviation (Sample) | 12.3% | 7.1% |
| Standard Deviation (Population) | 12.0% | 6.8% |
Demographics Similar to Mongolians and Marshallese by Unemployment Among Women with Children Ages 6 to 17 years
In terms of unemployment among women with children ages 6 to 17 years, the demographic groups most similar to Mongolians are Pakistani (8.4%, a difference of 0.010%), Immigrants from Belarus (8.4%, a difference of 0.040%), Iraqi (8.4%, a difference of 0.15%), Immigrants from Bolivia (8.4%, a difference of 0.16%), and Cypriot (8.4%, a difference of 0.18%). Similarly, the demographic groups most similar to Marshallese are Immigrants from Thailand (8.3%, a difference of 0.030%), Armenian (8.3%, a difference of 0.080%), Norwegian (8.3%, a difference of 0.11%), Luxembourger (8.3%, a difference of 0.18%), and Immigrants from Australia (8.3%, a difference of 0.18%).
| Demographics | Rating | Rank | Unemployment Among Women with Children Ages 6 to 17 years |
| Immigrants | South Eastern Asia | 99.9 /100 | #63 | Exceptional 8.2% |
| Immigrants | Kuwait | 99.9 /100 | #64 | Exceptional 8.3% |
| Immigrants | Albania | 99.9 /100 | #65 | Exceptional 8.3% |
| Luxembourgers | 99.9 /100 | #66 | Exceptional 8.3% |
| Armenians | 99.9 /100 | #67 | Exceptional 8.3% |
| Marshallese | 99.9 /100 | #68 | Exceptional 8.3% |
| Immigrants | Thailand | 99.9 /100 | #69 | Exceptional 8.3% |
| Norwegians | 99.9 /100 | #70 | Exceptional 8.3% |
| Immigrants | Australia | 99.8 /100 | #71 | Exceptional 8.3% |
| Immigrants | Nepal | 99.8 /100 | #72 | Exceptional 8.3% |
| Spanish Americans | 99.8 /100 | #73 | Exceptional 8.4% |
| Samoans | 99.7 /100 | #74 | Exceptional 8.4% |
| Immigrants | Sri Lanka | 99.7 /100 | #75 | Exceptional 8.4% |
| Immigrants | Moldova | 99.7 /100 | #76 | Exceptional 8.4% |
| Iraqis | 99.7 /100 | #77 | Exceptional 8.4% |
| Pakistanis | 99.6 /100 | #78 | Exceptional 8.4% |
| Mongolians | 99.6 /100 | #79 | Exceptional 8.4% |
| Immigrants | Belarus | 99.6 /100 | #80 | Exceptional 8.4% |
| Immigrants | Bolivia | 99.6 /100 | #81 | Exceptional 8.4% |
| Cypriots | 99.6 /100 | #82 | Exceptional 8.4% |
| Bulgarians | 99.5 /100 | #83 | Exceptional 8.4% |