Haitian vs French American Indian Unemployment Among Ages 35 to 44 years
COMPARE
Haitian
French American Indian
Unemployment Among Ages 35 to 44 years
Unemployment Among Ages 35 to 44 years Comparison
Haitians
French American Indians
5.5%
UNEMPLOYMENT AMONG AGES 35 TO 44 YEARS
0.0/ 100
METRIC RATING
284th/ 347
METRIC RANK
5.5%
UNEMPLOYMENT AMONG AGES 35 TO 44 YEARS
0.0/ 100
METRIC RATING
287th/ 347
METRIC RANK
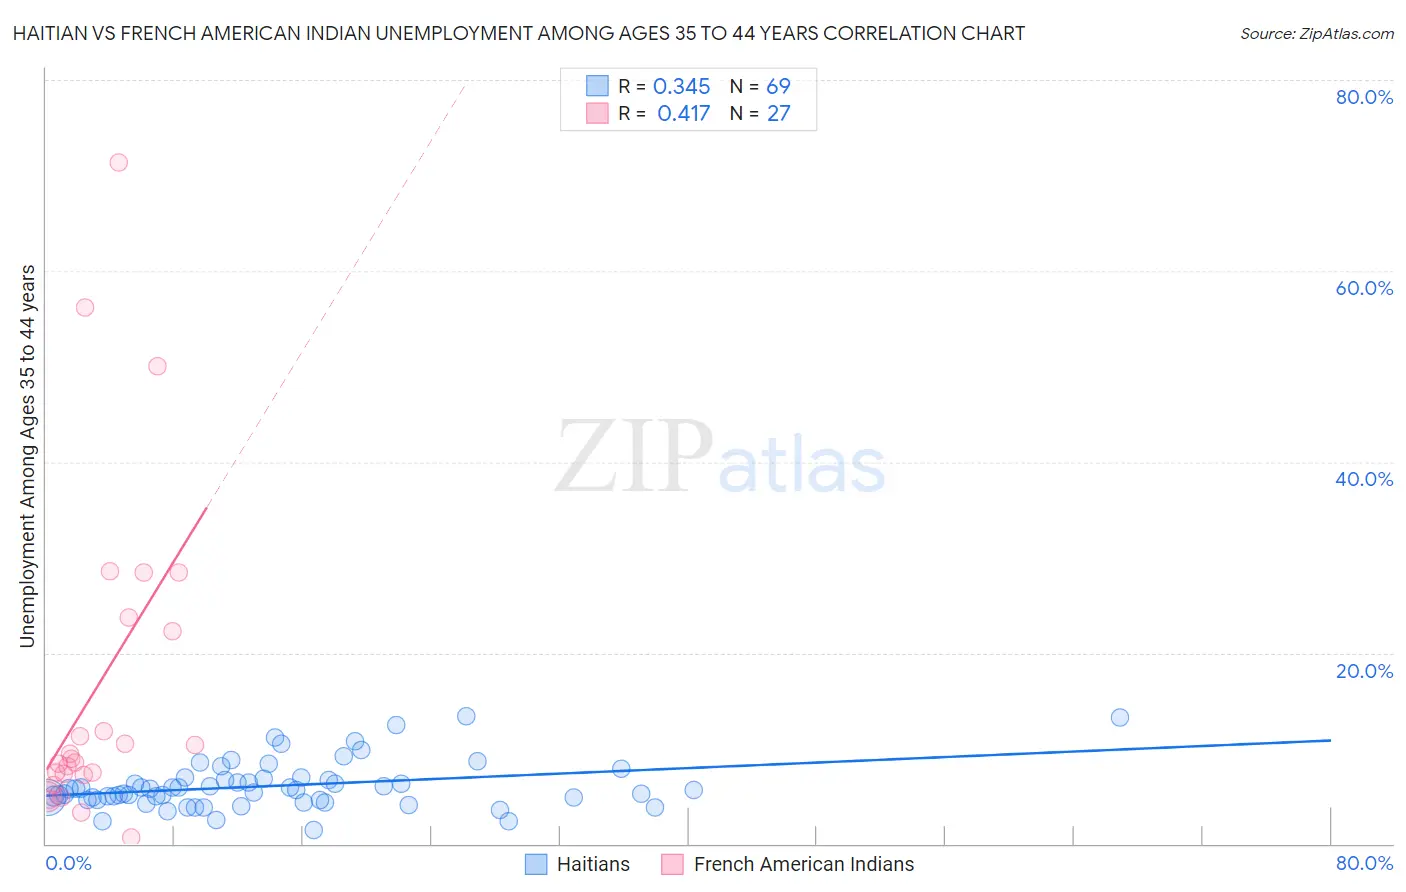
Haitian vs French American Indian Unemployment Among Ages 35 to 44 years Correlation Chart
The statistical analysis conducted on geographies consisting of 283,461,546 people shows a mild positive correlation between the proportion of Haitians and unemployment rate among population between the ages 35 and 44 in the United States with a correlation coefficient (R) of 0.345 and weighted average of 5.5%. Similarly, the statistical analysis conducted on geographies consisting of 130,378,290 people shows a moderate positive correlation between the proportion of French American Indians and unemployment rate among population between the ages 35 and 44 in the United States with a correlation coefficient (R) of 0.417 and weighted average of 5.5%, a difference of 0.40%.
Unemployment Among Ages 35 to 44 years Correlation Summary
| Measurement | Haitian | French American Indian |
| Minimum | 1.5% | 0.70% |
| Maximum | 13.4% | 71.4% |
| Range | 11.9% | 70.7% |
| Mean | 6.1% | 16.7% |
| Median | 5.7% | 8.9% |
| Interquartile 25% (IQ1) | 4.6% | 7.2% |
| Interquartile 75% (IQ3) | 6.8% | 23.7% |
| Interquartile Range (IQR) | 2.1% | 16.5% |
| Standard Deviation (Sample) | 2.4% | 17.5% |
| Standard Deviation (Population) | 2.4% | 17.1% |
Demographics Similar to Haitians and French American Indians by Unemployment Among Ages 35 to 44 years
In terms of unemployment among ages 35 to 44 years, the demographic groups most similar to Haitians are Hispanic or Latino (5.5%, a difference of 0.16%), Immigrants from Micronesia (5.5%, a difference of 0.28%), Immigrants from Ecuador (5.4%, a difference of 0.54%), Cree (5.5%, a difference of 0.56%), and Spanish American Indian (5.5%, a difference of 0.89%). Similarly, the demographic groups most similar to French American Indians are Immigrants from Micronesia (5.5%, a difference of 0.12%), Cree (5.5%, a difference of 0.16%), Hispanic or Latino (5.5%, a difference of 0.24%), Spanish American Indian (5.5%, a difference of 0.49%), and Jamaican (5.5%, a difference of 0.57%).
| Demographics | Rating | Rank | Unemployment Among Ages 35 to 44 years |
| Immigrants | Mexico | 0.0 /100 | #275 | Tragic 5.4% |
| Native Hawaiians | 0.0 /100 | #276 | Tragic 5.4% |
| Immigrants | Caribbean | 0.0 /100 | #277 | Tragic 5.4% |
| Lumbee | 0.0 /100 | #278 | Tragic 5.4% |
| Immigrants | Senegal | 0.0 /100 | #279 | Tragic 5.4% |
| Ecuadorians | 0.0 /100 | #280 | Tragic 5.4% |
| Immigrants | Portugal | 0.0 /100 | #281 | Tragic 5.4% |
| Immigrants | Ghana | 0.0 /100 | #282 | Tragic 5.4% |
| Immigrants | Ecuador | 0.0 /100 | #283 | Tragic 5.4% |
| Haitians | 0.0 /100 | #284 | Tragic 5.5% |
| Hispanics or Latinos | 0.0 /100 | #285 | Tragic 5.5% |
| Immigrants | Micronesia | 0.0 /100 | #286 | Tragic 5.5% |
| French American Indians | 0.0 /100 | #287 | Tragic 5.5% |
| Cree | 0.0 /100 | #288 | Tragic 5.5% |
| Spanish American Indians | 0.0 /100 | #289 | Tragic 5.5% |
| Jamaicans | 0.0 /100 | #290 | Tragic 5.5% |
| Dutch West Indians | 0.0 /100 | #291 | Tragic 5.5% |
| Immigrants | Haiti | 0.0 /100 | #292 | Tragic 5.5% |
| Central American Indians | 0.0 /100 | #293 | Tragic 5.6% |
| Trinidadians and Tobagonians | 0.0 /100 | #294 | Tragic 5.6% |
| Ottawa | 0.0 /100 | #295 | Tragic 5.6% |