Haitian vs Arab Unemployment Among Ages 35 to 44 years
COMPARE
Haitian
Arab
Unemployment Among Ages 35 to 44 years
Unemployment Among Ages 35 to 44 years Comparison
Haitians
Arabs
5.5%
UNEMPLOYMENT AMONG AGES 35 TO 44 YEARS
0.0/ 100
METRIC RATING
284th/ 347
METRIC RANK
4.7%
UNEMPLOYMENT AMONG AGES 35 TO 44 YEARS
53.1/ 100
METRIC RATING
168th/ 347
METRIC RANK
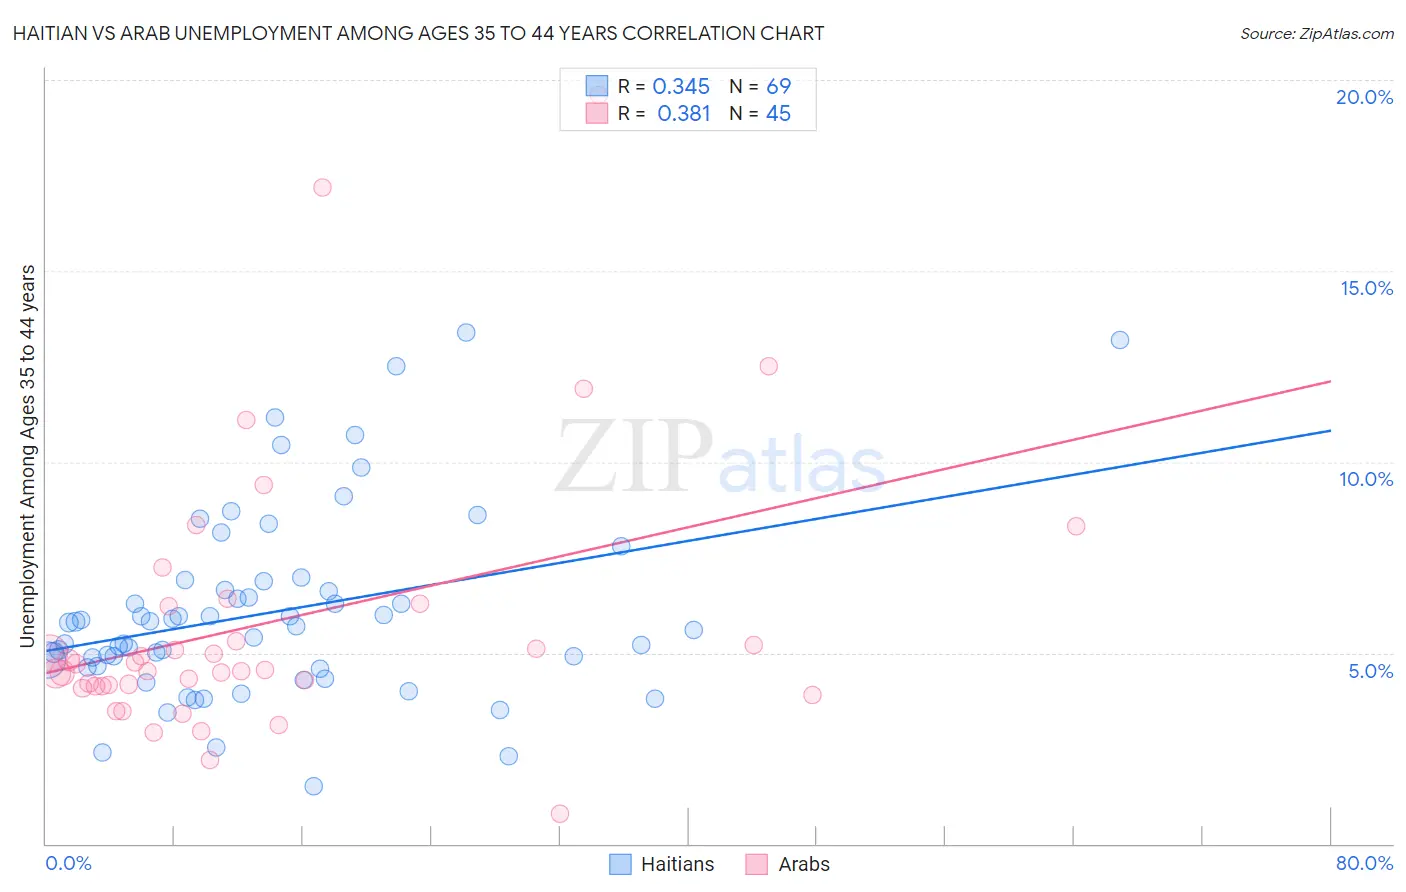
Haitian vs Arab Unemployment Among Ages 35 to 44 years Correlation Chart
The statistical analysis conducted on geographies consisting of 283,461,546 people shows a mild positive correlation between the proportion of Haitians and unemployment rate among population between the ages 35 and 44 in the United States with a correlation coefficient (R) of 0.345 and weighted average of 5.5%. Similarly, the statistical analysis conducted on geographies consisting of 470,593,909 people shows a mild positive correlation between the proportion of Arabs and unemployment rate among population between the ages 35 and 44 in the United States with a correlation coefficient (R) of 0.381 and weighted average of 4.7%, a difference of 17.1%.
Unemployment Among Ages 35 to 44 years Correlation Summary
| Measurement | Haitian | Arab |
| Minimum | 1.5% | 0.80% |
| Maximum | 13.4% | 19.6% |
| Range | 11.9% | 18.8% |
| Mean | 6.1% | 5.8% |
| Median | 5.7% | 4.6% |
| Interquartile 25% (IQ1) | 4.6% | 4.1% |
| Interquartile 75% (IQ3) | 6.8% | 6.3% |
| Interquartile Range (IQR) | 2.1% | 2.1% |
| Standard Deviation (Sample) | 2.4% | 3.6% |
| Standard Deviation (Population) | 2.4% | 3.6% |
Similar Demographics by Unemployment Among Ages 35 to 44 years
Demographics Similar to Haitians by Unemployment Among Ages 35 to 44 years
In terms of unemployment among ages 35 to 44 years, the demographic groups most similar to Haitians are Hispanic or Latino (5.5%, a difference of 0.16%), Immigrants from Micronesia (5.5%, a difference of 0.28%), French American Indian (5.5%, a difference of 0.40%), Immigrants from Ecuador (5.4%, a difference of 0.54%), and Cree (5.5%, a difference of 0.56%).
| Demographics | Rating | Rank | Unemployment Among Ages 35 to 44 years |
| Immigrants | Caribbean | 0.0 /100 | #277 | Tragic 5.4% |
| Lumbee | 0.0 /100 | #278 | Tragic 5.4% |
| Immigrants | Senegal | 0.0 /100 | #279 | Tragic 5.4% |
| Ecuadorians | 0.0 /100 | #280 | Tragic 5.4% |
| Immigrants | Portugal | 0.0 /100 | #281 | Tragic 5.4% |
| Immigrants | Ghana | 0.0 /100 | #282 | Tragic 5.4% |
| Immigrants | Ecuador | 0.0 /100 | #283 | Tragic 5.4% |
| Haitians | 0.0 /100 | #284 | Tragic 5.5% |
| Hispanics or Latinos | 0.0 /100 | #285 | Tragic 5.5% |
| Immigrants | Micronesia | 0.0 /100 | #286 | Tragic 5.5% |
| French American Indians | 0.0 /100 | #287 | Tragic 5.5% |
| Cree | 0.0 /100 | #288 | Tragic 5.5% |
| Spanish American Indians | 0.0 /100 | #289 | Tragic 5.5% |
| Jamaicans | 0.0 /100 | #290 | Tragic 5.5% |
| Dutch West Indians | 0.0 /100 | #291 | Tragic 5.5% |
Demographics Similar to Arabs by Unemployment Among Ages 35 to 44 years
In terms of unemployment among ages 35 to 44 years, the demographic groups most similar to Arabs are Pennsylvania German (4.7%, a difference of 0.010%), Immigrants from Indonesia (4.7%, a difference of 0.040%), Peruvian (4.7%, a difference of 0.090%), Indonesian (4.7%, a difference of 0.10%), and Lebanese (4.7%, a difference of 0.13%).
| Demographics | Rating | Rank | Unemployment Among Ages 35 to 44 years |
| Celtics | 61.7 /100 | #161 | Good 4.7% |
| Costa Ricans | 59.6 /100 | #162 | Average 4.7% |
| South Africans | 58.5 /100 | #163 | Average 4.7% |
| Immigrants | Morocco | 57.2 /100 | #164 | Average 4.7% |
| German Russians | 57.2 /100 | #165 | Average 4.7% |
| French | 55.6 /100 | #166 | Average 4.7% |
| Peruvians | 54.4 /100 | #167 | Average 4.7% |
| Arabs | 53.1 /100 | #168 | Average 4.7% |
| Pennsylvania Germans | 53.0 /100 | #169 | Average 4.7% |
| Immigrants | Indonesia | 52.6 /100 | #170 | Average 4.7% |
| Indonesians | 51.7 /100 | #171 | Average 4.7% |
| Lebanese | 51.4 /100 | #172 | Average 4.7% |
| Iraqis | 50.9 /100 | #173 | Average 4.7% |
| Afghans | 50.0 /100 | #174 | Average 4.7% |
| Immigrants | Germany | 48.9 /100 | #175 | Average 4.7% |