Guyanese vs Nepalese Unemployment Among Women with Children Under 6 years
COMPARE
Guyanese
Nepalese
Unemployment Among Women with Children Under 6 years
Unemployment Among Women with Children Under 6 years Comparison
Guyanese
Nepalese
8.2%
UNEMPLOYMENT AMONG WOMEN WITH CHILDREN UNDER 6 YEARS
1.0/ 100
METRIC RATING
251st/ 347
METRIC RANK
7.7%
UNEMPLOYMENT AMONG WOMEN WITH CHILDREN UNDER 6 YEARS
43.5/ 100
METRIC RATING
182nd/ 347
METRIC RANK
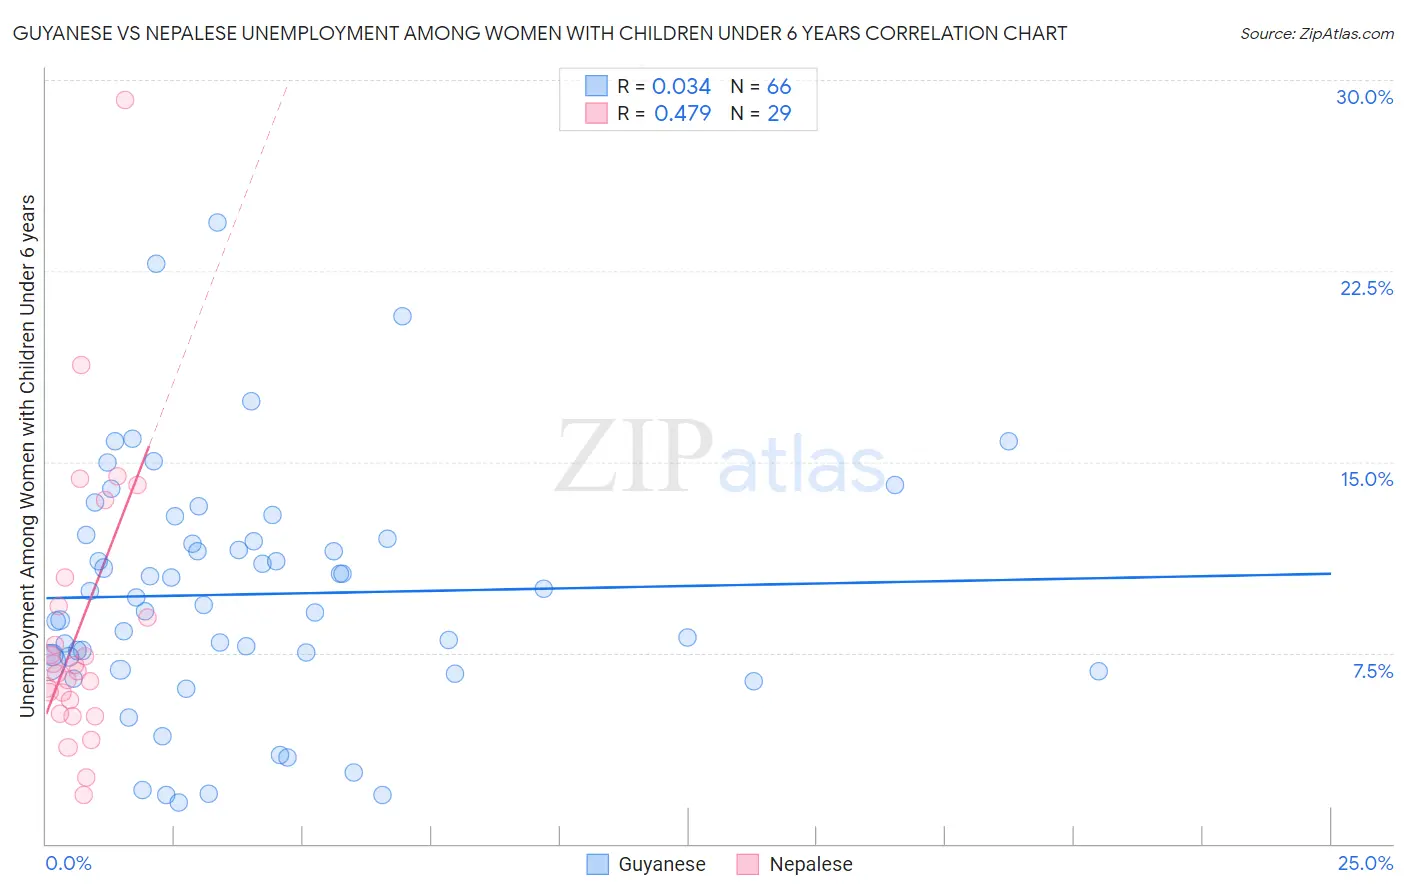
Guyanese vs Nepalese Unemployment Among Women with Children Under 6 years Correlation Chart
The statistical analysis conducted on geographies consisting of 150,761,522 people shows no correlation between the proportion of Guyanese and unemployment rate among women with children under the age of 6 in the United States with a correlation coefficient (R) of 0.034 and weighted average of 8.2%. Similarly, the statistical analysis conducted on geographies consisting of 22,749,032 people shows a moderate positive correlation between the proportion of Nepalese and unemployment rate among women with children under the age of 6 in the United States with a correlation coefficient (R) of 0.479 and weighted average of 7.7%, a difference of 7.2%.
Unemployment Among Women with Children Under 6 years Correlation Summary
| Measurement | Guyanese | Nepalese |
| Minimum | 1.6% | 1.9% |
| Maximum | 24.4% | 29.2% |
| Range | 22.8% | 27.3% |
| Mean | 9.8% | 8.5% |
| Median | 9.5% | 6.8% |
| Interquartile 25% (IQ1) | 7.1% | 5.4% |
| Interquartile 75% (IQ3) | 12.0% | 9.9% |
| Interquartile Range (IQR) | 4.9% | 4.5% |
| Standard Deviation (Sample) | 4.7% | 5.6% |
| Standard Deviation (Population) | 4.7% | 5.5% |
Similar Demographics by Unemployment Among Women with Children Under 6 years
Demographics Similar to Guyanese by Unemployment Among Women with Children Under 6 years
In terms of unemployment among women with children under 6 years, the demographic groups most similar to Guyanese are Ghanaian (8.2%, a difference of 0.0%), Nigerian (8.2%, a difference of 0.17%), Immigrants from Sierra Leone (8.2%, a difference of 0.18%), Immigrants from Guyana (8.2%, a difference of 0.18%), and Immigrants from Western Africa (8.2%, a difference of 0.27%).
| Demographics | Rating | Rank | Unemployment Among Women with Children Under 6 years |
| French | 1.7 /100 | #244 | Tragic 8.2% |
| Native Hawaiians | 1.7 /100 | #245 | Tragic 8.2% |
| Central Americans | 1.4 /100 | #246 | Tragic 8.2% |
| German Russians | 1.2 /100 | #247 | Tragic 8.2% |
| Immigrants | Western Africa | 1.1 /100 | #248 | Tragic 8.2% |
| Immigrants | Sierra Leone | 1.1 /100 | #249 | Tragic 8.2% |
| Nigerians | 1.1 /100 | #250 | Tragic 8.2% |
| Guyanese | 1.0 /100 | #251 | Tragic 8.2% |
| Ghanaians | 1.0 /100 | #252 | Tragic 8.2% |
| Immigrants | Guyana | 0.8 /100 | #253 | Tragic 8.2% |
| Immigrants | Caribbean | 0.7 /100 | #254 | Tragic 8.3% |
| Immigrants | Portugal | 0.6 /100 | #255 | Tragic 8.3% |
| Celtics | 0.6 /100 | #256 | Tragic 8.3% |
| British West Indians | 0.5 /100 | #257 | Tragic 8.3% |
| Immigrants | Ghana | 0.5 /100 | #258 | Tragic 8.3% |
Demographics Similar to Nepalese by Unemployment Among Women with Children Under 6 years
In terms of unemployment among women with children under 6 years, the demographic groups most similar to Nepalese are Brazilian (7.7%, a difference of 0.020%), Sierra Leonean (7.7%, a difference of 0.040%), Immigrants from Uruguay (7.7%, a difference of 0.060%), Immigrants from Western Europe (7.7%, a difference of 0.090%), and Immigrants from England (7.7%, a difference of 0.12%).
| Demographics | Rating | Rank | Unemployment Among Women with Children Under 6 years |
| Panamanians | 49.6 /100 | #175 | Average 7.6% |
| Puget Sound Salish | 47.7 /100 | #176 | Average 7.7% |
| Austrians | 46.0 /100 | #177 | Average 7.7% |
| Immigrants | England | 45.4 /100 | #178 | Average 7.7% |
| Immigrants | Western Europe | 44.9 /100 | #179 | Average 7.7% |
| Immigrants | Uruguay | 44.5 /100 | #180 | Average 7.7% |
| Brazilians | 43.9 /100 | #181 | Average 7.7% |
| Nepalese | 43.5 /100 | #182 | Average 7.7% |
| Sierra Leoneans | 42.9 /100 | #183 | Average 7.7% |
| Indonesians | 40.5 /100 | #184 | Average 7.7% |
| Spanish Americans | 39.7 /100 | #185 | Fair 7.7% |
| Yugoslavians | 39.4 /100 | #186 | Fair 7.7% |
| Immigrants | Thailand | 38.5 /100 | #187 | Fair 7.7% |
| Czechoslovakians | 38.4 /100 | #188 | Fair 7.7% |
| Immigrants | Panama | 35.7 /100 | #189 | Fair 7.7% |