Guyanese vs Latvian Unemployment Among Ages 20 to 24 years
COMPARE
Guyanese
Latvian
Unemployment Among Ages 20 to 24 years
Unemployment Among Ages 20 to 24 years Comparison
Guyanese
Latvians
14.0%
UNEMPLOYMENT AMONG AGES 20 TO 24 YEARS
0.0/ 100
METRIC RATING
334th/ 347
METRIC RANK
9.9%
UNEMPLOYMENT AMONG AGES 20 TO 24 YEARS
97.9/ 100
METRIC RATING
84th/ 347
METRIC RANK
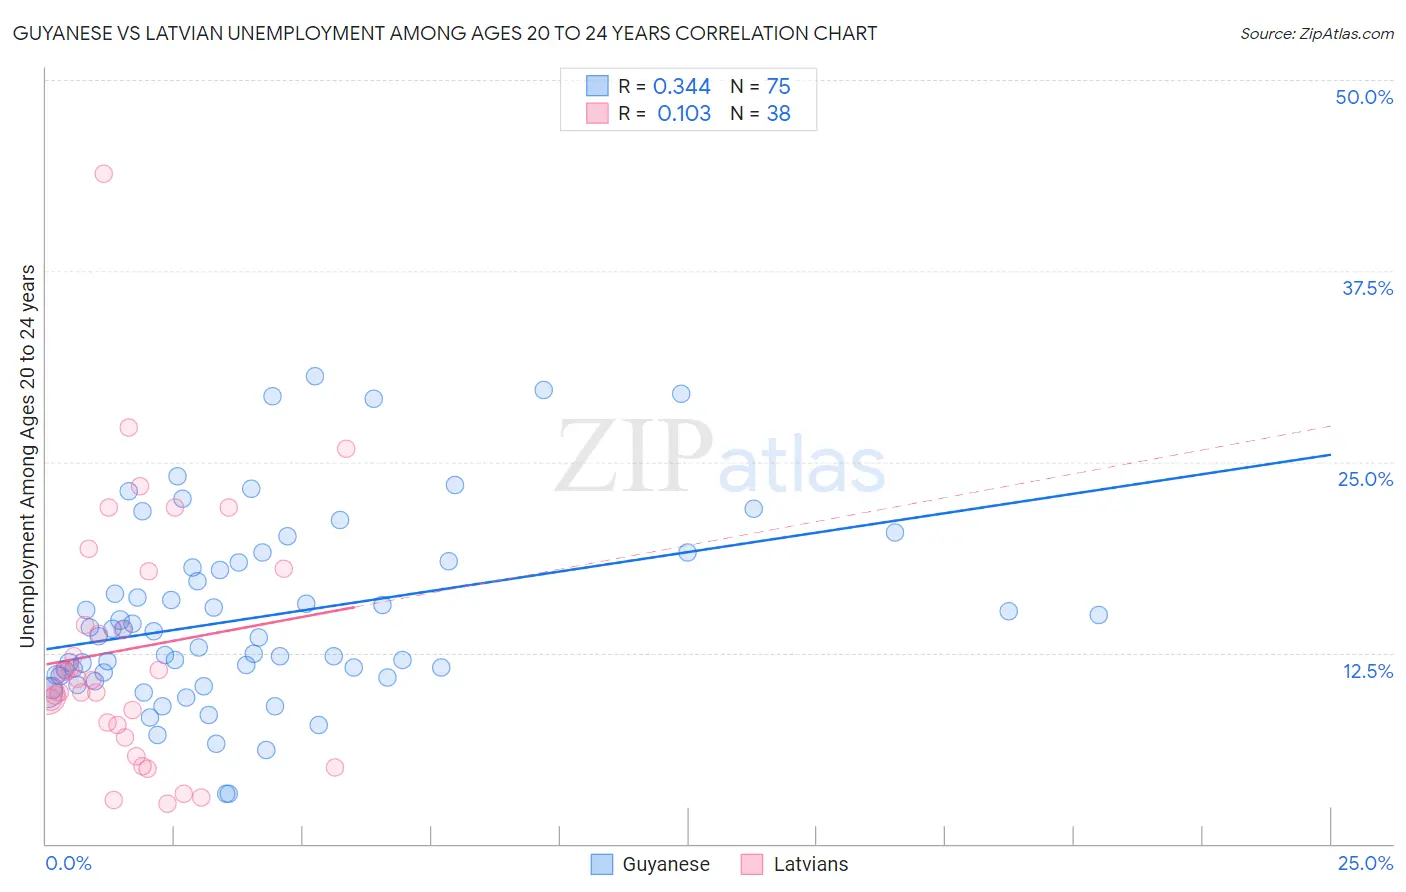
Guyanese vs Latvian Unemployment Among Ages 20 to 24 years Correlation Chart
The statistical analysis conducted on geographies consisting of 175,080,797 people shows a mild positive correlation between the proportion of Guyanese and unemployment rate among population between the ages 20 and 24 in the United States with a correlation coefficient (R) of 0.344 and weighted average of 14.0%. Similarly, the statistical analysis conducted on geographies consisting of 215,911,655 people shows a poor positive correlation between the proportion of Latvians and unemployment rate among population between the ages 20 and 24 in the United States with a correlation coefficient (R) of 0.103 and weighted average of 9.9%, a difference of 40.7%.
Unemployment Among Ages 20 to 24 years Correlation Summary
| Measurement | Guyanese | Latvian |
| Minimum | 3.3% | 2.7% |
| Maximum | 30.6% | 43.9% |
| Range | 27.3% | 41.2% |
| Mean | 14.9% | 12.8% |
| Median | 13.6% | 10.8% |
| Interquartile 25% (IQ1) | 11.0% | 7.8% |
| Interquartile 75% (IQ3) | 18.4% | 17.8% |
| Interquartile Range (IQR) | 7.4% | 10.0% |
| Standard Deviation (Sample) | 6.1% | 8.4% |
| Standard Deviation (Population) | 6.1% | 8.3% |
Similar Demographics by Unemployment Among Ages 20 to 24 years
Demographics Similar to Guyanese by Unemployment Among Ages 20 to 24 years
In terms of unemployment among ages 20 to 24 years, the demographic groups most similar to Guyanese are Immigrants from Guyana (13.9%, a difference of 0.50%), Immigrants from Grenada (13.8%, a difference of 1.0%), Aleut (13.8%, a difference of 1.1%), Sioux (14.2%, a difference of 1.2%), and Arapaho (13.8%, a difference of 1.3%).
| Demographics | Rating | Rank | Unemployment Among Ages 20 to 24 years |
| Immigrants | Dominican Republic | 0.0 /100 | #327 | Tragic 13.6% |
| British West Indians | 0.0 /100 | #328 | Tragic 13.7% |
| Dominicans | 0.0 /100 | #329 | Tragic 13.8% |
| Arapaho | 0.0 /100 | #330 | Tragic 13.8% |
| Aleuts | 0.0 /100 | #331 | Tragic 13.8% |
| Immigrants | Grenada | 0.0 /100 | #332 | Tragic 13.8% |
| Immigrants | Guyana | 0.0 /100 | #333 | Tragic 13.9% |
| Guyanese | 0.0 /100 | #334 | Tragic 14.0% |
| Sioux | 0.0 /100 | #335 | Tragic 14.2% |
| Pima | 0.0 /100 | #336 | Tragic 14.2% |
| Paiute | 0.0 /100 | #337 | Tragic 14.3% |
| Immigrants | St. Vincent and the Grenadines | 0.0 /100 | #338 | Tragic 14.3% |
| Immigrants | Yemen | 0.0 /100 | #339 | Tragic 14.9% |
| Yuman | 0.0 /100 | #340 | Tragic 15.8% |
| Navajo | 0.0 /100 | #341 | Tragic 16.1% |
Demographics Similar to Latvians by Unemployment Among Ages 20 to 24 years
In terms of unemployment among ages 20 to 24 years, the demographic groups most similar to Latvians are Immigrants from Bulgaria (9.9%, a difference of 0.010%), Yaqui (9.9%, a difference of 0.030%), Sri Lankan (9.9%, a difference of 0.030%), New Zealander (9.9%, a difference of 0.050%), and Immigrants from Netherlands (9.9%, a difference of 0.14%).
| Demographics | Rating | Rank | Unemployment Among Ages 20 to 24 years |
| Chickasaw | 98.4 /100 | #77 | Exceptional 9.9% |
| Assyrians/Chaldeans/Syriacs | 98.3 /100 | #78 | Exceptional 9.9% |
| Icelanders | 98.3 /100 | #79 | Exceptional 9.9% |
| Immigrants | Netherlands | 98.2 /100 | #80 | Exceptional 9.9% |
| Yaqui | 98.0 /100 | #81 | Exceptional 9.9% |
| Sri Lankans | 98.0 /100 | #82 | Exceptional 9.9% |
| Immigrants | Bulgaria | 98.0 /100 | #83 | Exceptional 9.9% |
| Latvians | 97.9 /100 | #84 | Exceptional 9.9% |
| New Zealanders | 97.8 /100 | #85 | Exceptional 9.9% |
| Immigrants | Vietnam | 97.5 /100 | #86 | Exceptional 10.0% |
| Immigrants | Oceania | 97.4 /100 | #87 | Exceptional 10.0% |
| Poles | 97.1 /100 | #88 | Exceptional 10.0% |
| Macedonians | 97.0 /100 | #89 | Exceptional 10.0% |
| Chileans | 97.0 /100 | #90 | Exceptional 10.0% |
| Bhutanese | 96.9 /100 | #91 | Exceptional 10.0% |