Guyanese vs Immigrants from Bangladesh Unemployment Among Ages 20 to 24 years
COMPARE
Guyanese
Immigrants from Bangladesh
Unemployment Among Ages 20 to 24 years
Unemployment Among Ages 20 to 24 years Comparison
Guyanese
Immigrants from Bangladesh
14.0%
UNEMPLOYMENT AMONG AGES 20 TO 24 YEARS
0.0/ 100
METRIC RATING
334th/ 347
METRIC RANK
12.6%
UNEMPLOYMENT AMONG AGES 20 TO 24 YEARS
0.0/ 100
METRIC RATING
309th/ 347
METRIC RANK
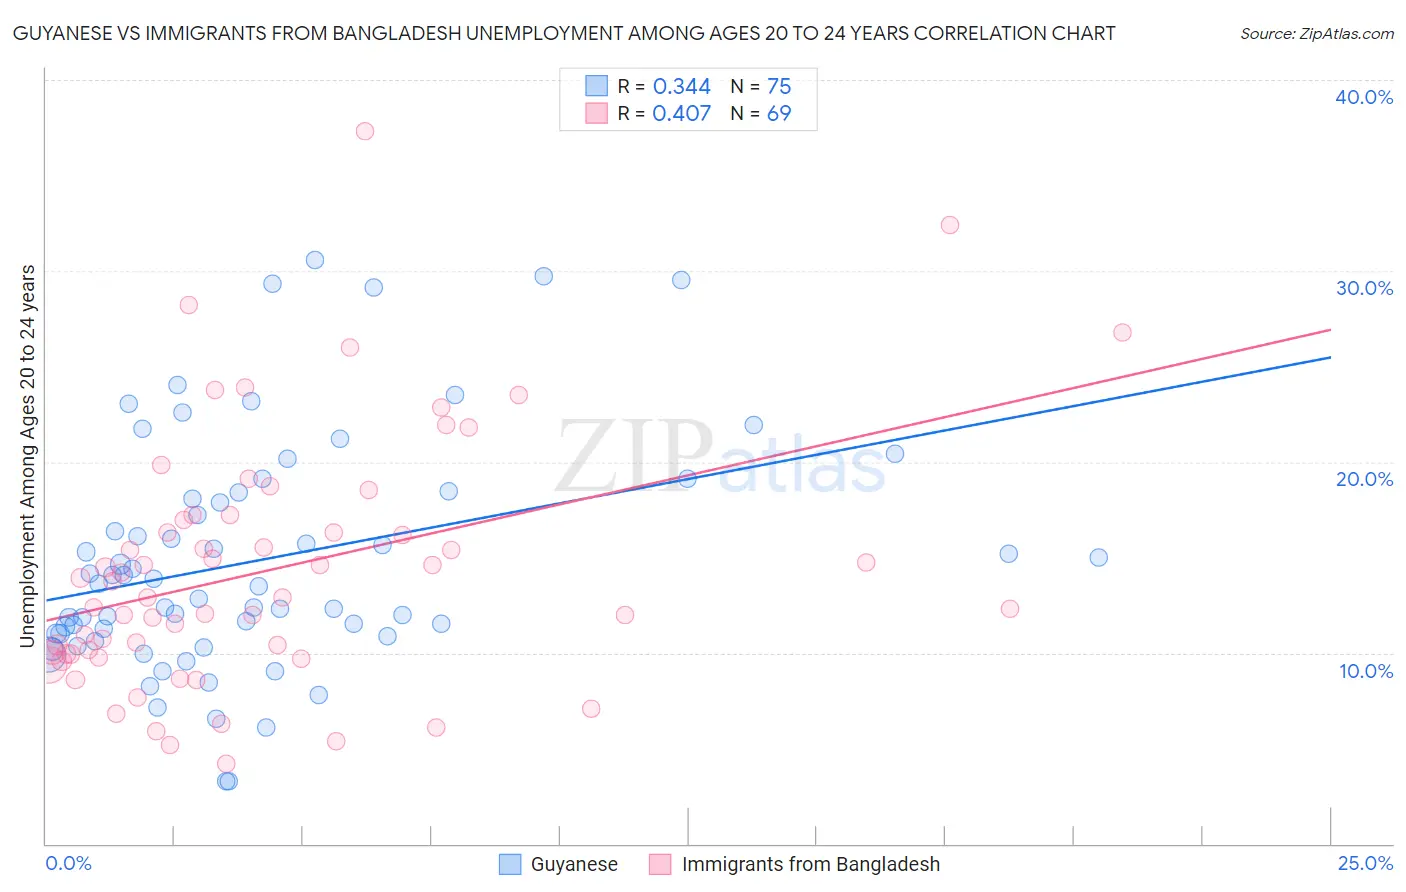
Guyanese vs Immigrants from Bangladesh Unemployment Among Ages 20 to 24 years Correlation Chart
The statistical analysis conducted on geographies consisting of 175,080,797 people shows a mild positive correlation between the proportion of Guyanese and unemployment rate among population between the ages 20 and 24 in the United States with a correlation coefficient (R) of 0.344 and weighted average of 14.0%. Similarly, the statistical analysis conducted on geographies consisting of 201,651,258 people shows a moderate positive correlation between the proportion of Immigrants from Bangladesh and unemployment rate among population between the ages 20 and 24 in the United States with a correlation coefficient (R) of 0.407 and weighted average of 12.6%, a difference of 11.5%.
Unemployment Among Ages 20 to 24 years Correlation Summary
| Measurement | Guyanese | Immigrants from Bangladesh |
| Minimum | 3.3% | 4.2% |
| Maximum | 30.6% | 37.3% |
| Range | 27.3% | 33.1% |
| Mean | 14.9% | 14.3% |
| Median | 13.6% | 12.9% |
| Interquartile 25% (IQ1) | 11.0% | 10.0% |
| Interquartile 75% (IQ3) | 18.4% | 17.1% |
| Interquartile Range (IQR) | 7.4% | 7.1% |
| Standard Deviation (Sample) | 6.1% | 6.6% |
| Standard Deviation (Population) | 6.1% | 6.5% |
Similar Demographics by Unemployment Among Ages 20 to 24 years
Demographics Similar to Guyanese by Unemployment Among Ages 20 to 24 years
In terms of unemployment among ages 20 to 24 years, the demographic groups most similar to Guyanese are Immigrants from Guyana (13.9%, a difference of 0.50%), Immigrants from Grenada (13.8%, a difference of 1.0%), Aleut (13.8%, a difference of 1.1%), Sioux (14.2%, a difference of 1.2%), and Arapaho (13.8%, a difference of 1.3%).
| Demographics | Rating | Rank | Unemployment Among Ages 20 to 24 years |
| Immigrants | Dominican Republic | 0.0 /100 | #327 | Tragic 13.6% |
| British West Indians | 0.0 /100 | #328 | Tragic 13.7% |
| Dominicans | 0.0 /100 | #329 | Tragic 13.8% |
| Arapaho | 0.0 /100 | #330 | Tragic 13.8% |
| Aleuts | 0.0 /100 | #331 | Tragic 13.8% |
| Immigrants | Grenada | 0.0 /100 | #332 | Tragic 13.8% |
| Immigrants | Guyana | 0.0 /100 | #333 | Tragic 13.9% |
| Guyanese | 0.0 /100 | #334 | Tragic 14.0% |
| Sioux | 0.0 /100 | #335 | Tragic 14.2% |
| Pima | 0.0 /100 | #336 | Tragic 14.2% |
| Paiute | 0.0 /100 | #337 | Tragic 14.3% |
| Immigrants | St. Vincent and the Grenadines | 0.0 /100 | #338 | Tragic 14.3% |
| Immigrants | Yemen | 0.0 /100 | #339 | Tragic 14.9% |
| Yuman | 0.0 /100 | #340 | Tragic 15.8% |
| Navajo | 0.0 /100 | #341 | Tragic 16.1% |
Demographics Similar to Immigrants from Bangladesh by Unemployment Among Ages 20 to 24 years
In terms of unemployment among ages 20 to 24 years, the demographic groups most similar to Immigrants from Bangladesh are Tohono O'odham (12.5%, a difference of 0.080%), Jamaican (12.6%, a difference of 0.12%), Vietnamese (12.6%, a difference of 0.57%), Houma (12.6%, a difference of 0.72%), and Bermudan (12.5%, a difference of 0.76%).
| Demographics | Rating | Rank | Unemployment Among Ages 20 to 24 years |
| Immigrants | Cabo Verde | 0.0 /100 | #302 | Tragic 12.2% |
| Haitians | 0.0 /100 | #303 | Tragic 12.2% |
| Immigrants | West Indies | 0.0 /100 | #304 | Tragic 12.3% |
| Chippewa | 0.0 /100 | #305 | Tragic 12.3% |
| Immigrants | Haiti | 0.0 /100 | #306 | Tragic 12.4% |
| Bermudans | 0.0 /100 | #307 | Tragic 12.5% |
| Tohono O'odham | 0.0 /100 | #308 | Tragic 12.5% |
| Immigrants | Bangladesh | 0.0 /100 | #309 | Tragic 12.6% |
| Jamaicans | 0.0 /100 | #310 | Tragic 12.6% |
| Vietnamese | 0.0 /100 | #311 | Tragic 12.6% |
| Houma | 0.0 /100 | #312 | Tragic 12.6% |
| Shoshone | 0.0 /100 | #313 | Tragic 12.7% |
| Blacks/African Americans | 0.0 /100 | #314 | Tragic 12.7% |
| West Indians | 0.0 /100 | #315 | Tragic 12.8% |
| Immigrants | Dominica | 0.0 /100 | #316 | Tragic 12.8% |