Uruguayan vs Immigrants from Lithuania Unemployment Among Ages 55 to 59 years
COMPARE
Uruguayan
Immigrants from Lithuania
Unemployment Among Ages 55 to 59 years
Unemployment Among Ages 55 to 59 years Comparison
Uruguayans
Immigrants from Lithuania
4.8%
UNEMPLOYMENT AMONG AGES 55 TO 59 YEARS
55.6/ 100
METRIC RATING
170th/ 347
METRIC RANK
4.8%
UNEMPLOYMENT AMONG AGES 55 TO 59 YEARS
70.8/ 100
METRIC RATING
149th/ 347
METRIC RANK
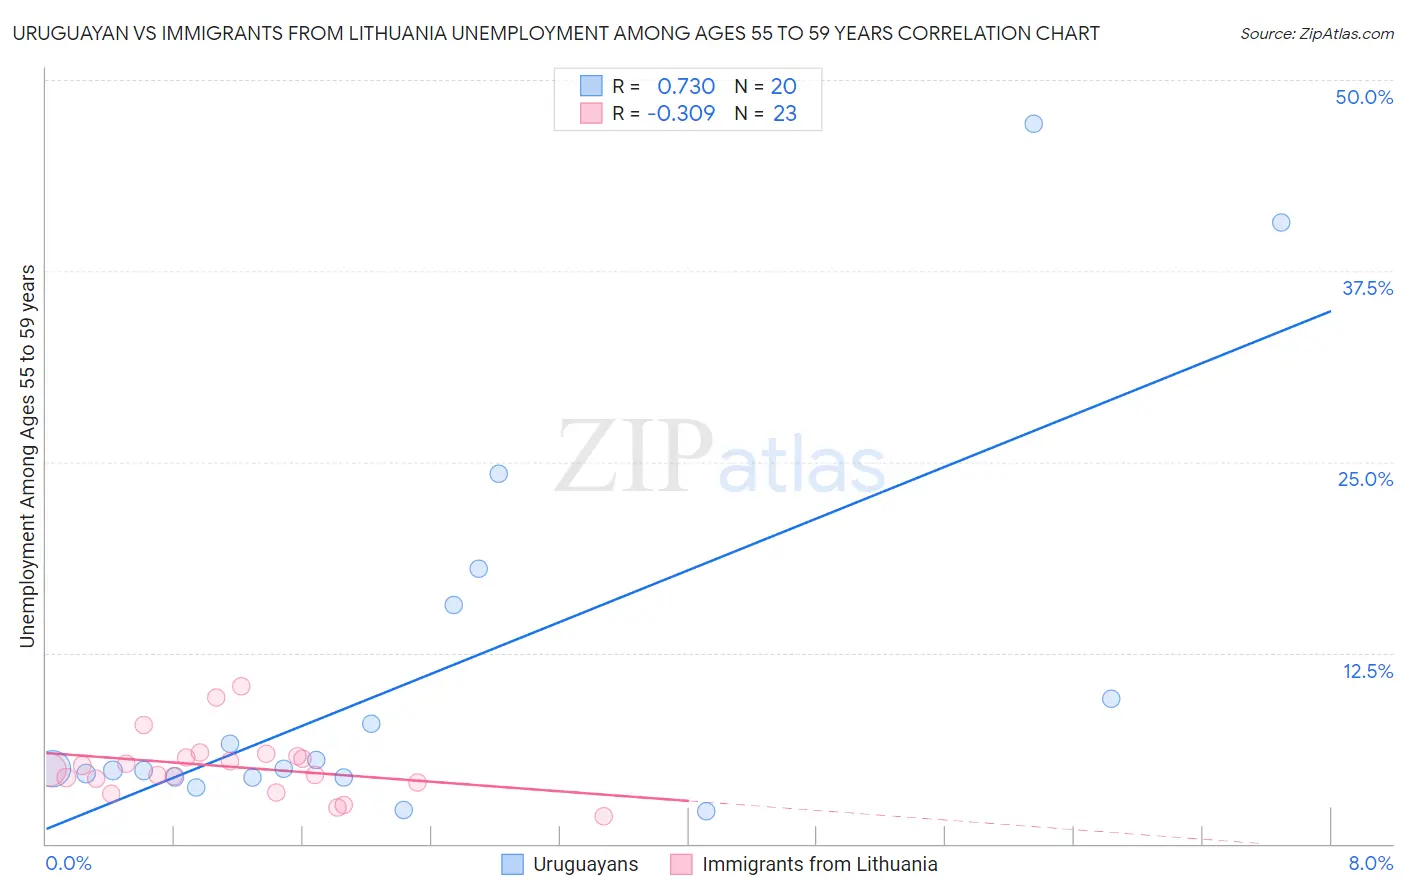
Uruguayan vs Immigrants from Lithuania Unemployment Among Ages 55 to 59 years Correlation Chart
The statistical analysis conducted on geographies consisting of 141,180,738 people shows a strong positive correlation between the proportion of Uruguayans and unemployment rate among population between the ages 55 and 59 in the United States with a correlation coefficient (R) of 0.730 and weighted average of 4.8%. Similarly, the statistical analysis conducted on geographies consisting of 115,061,362 people shows a mild negative correlation between the proportion of Immigrants from Lithuania and unemployment rate among population between the ages 55 and 59 in the United States with a correlation coefficient (R) of -0.309 and weighted average of 4.8%, a difference of 0.68%.
Unemployment Among Ages 55 to 59 years Correlation Summary
| Measurement | Uruguayan | Immigrants from Lithuania |
| Minimum | 2.1% | 1.8% |
| Maximum | 47.1% | 10.3% |
| Range | 45.0% | 8.5% |
| Mean | 11.0% | 5.1% |
| Median | 4.9% | 4.8% |
| Interquartile 25% (IQ1) | 4.4% | 4.0% |
| Interquartile 75% (IQ3) | 12.6% | 5.7% |
| Interquartile Range (IQR) | 8.2% | 1.7% |
| Standard Deviation (Sample) | 12.6% | 2.0% |
| Standard Deviation (Population) | 12.3% | 2.0% |
Similar Demographics by Unemployment Among Ages 55 to 59 years
Demographics Similar to Uruguayans by Unemployment Among Ages 55 to 59 years
In terms of unemployment among ages 55 to 59 years, the demographic groups most similar to Uruguayans are Japanese (4.8%, a difference of 0.050%), Nicaraguan (4.8%, a difference of 0.070%), Immigrants from Sudan (4.8%, a difference of 0.12%), Immigrants from Eastern Europe (4.8%, a difference of 0.14%), and Immigrants from Cambodia (4.8%, a difference of 0.15%).
| Demographics | Rating | Rank | Unemployment Among Ages 55 to 59 years |
| Immigrants | Lebanon | 63.8 /100 | #163 | Good 4.8% |
| Americans | 63.3 /100 | #164 | Good 4.8% |
| Immigrants | France | 62.0 /100 | #165 | Good 4.8% |
| Potawatomi | 62.0 /100 | #166 | Good 4.8% |
| Immigrants | Western Europe | 60.4 /100 | #167 | Good 4.8% |
| Immigrants | Cambodia | 59.3 /100 | #168 | Average 4.8% |
| Immigrants | Sudan | 58.4 /100 | #169 | Average 4.8% |
| Uruguayans | 55.6 /100 | #170 | Average 4.8% |
| Japanese | 54.5 /100 | #171 | Average 4.8% |
| Nicaraguans | 54.0 /100 | #172 | Average 4.8% |
| Immigrants | Eastern Europe | 52.2 /100 | #173 | Average 4.8% |
| Immigrants | Croatia | 50.0 /100 | #174 | Average 4.8% |
| Australians | 48.6 /100 | #175 | Average 4.8% |
| Samoans | 47.1 /100 | #176 | Average 4.8% |
| Immigrants | Sri Lanka | 46.8 /100 | #177 | Average 4.8% |
Demographics Similar to Immigrants from Lithuania by Unemployment Among Ages 55 to 59 years
In terms of unemployment among ages 55 to 59 years, the demographic groups most similar to Immigrants from Lithuania are Immigrants from Bahamas (4.8%, a difference of 0.050%), Immigrants from Northern Africa (4.8%, a difference of 0.050%), Bahamian (4.8%, a difference of 0.11%), Laotian (4.8%, a difference of 0.13%), and Immigrants from Uruguay (4.8%, a difference of 0.17%).
| Demographics | Rating | Rank | Unemployment Among Ages 55 to 59 years |
| Immigrants | Norway | 79.8 /100 | #142 | Good 4.8% |
| Ukrainians | 78.6 /100 | #143 | Good 4.8% |
| Immigrants | Asia | 77.8 /100 | #144 | Good 4.8% |
| Immigrants | Northern Europe | 77.5 /100 | #145 | Good 4.8% |
| Immigrants | South Eastern Asia | 77.4 /100 | #146 | Good 4.8% |
| Immigrants | Singapore | 76.6 /100 | #147 | Good 4.8% |
| Immigrants | Bahamas | 71.8 /100 | #148 | Good 4.8% |
| Immigrants | Lithuania | 70.8 /100 | #149 | Good 4.8% |
| Immigrants | Northern Africa | 69.8 /100 | #150 | Good 4.8% |
| Bahamians | 68.6 /100 | #151 | Good 4.8% |
| Laotians | 68.2 /100 | #152 | Good 4.8% |
| Immigrants | Uruguay | 67.2 /100 | #153 | Good 4.8% |
| Immigrants | Panama | 66.8 /100 | #154 | Good 4.8% |
| Immigrants | North Macedonia | 66.3 /100 | #155 | Good 4.8% |
| Italians | 66.2 /100 | #156 | Good 4.8% |