Immigrants from Belgium vs Delaware Unemployment Among Seniors over 75 years
COMPARE
Immigrants from Belgium
Delaware
Unemployment Among Seniors over 75 years
Unemployment Among Seniors over 75 years Comparison
Immigrants from Belgium
Delaware
8.2%
UNEMPLOYMENT AMONG SENIORS OVER 75 YEARS
99.3/ 100
METRIC RATING
96th/ 347
METRIC RANK
9.0%
UNEMPLOYMENT AMONG SENIORS OVER 75 YEARS
14.6/ 100
METRIC RATING
211th/ 347
METRIC RANK
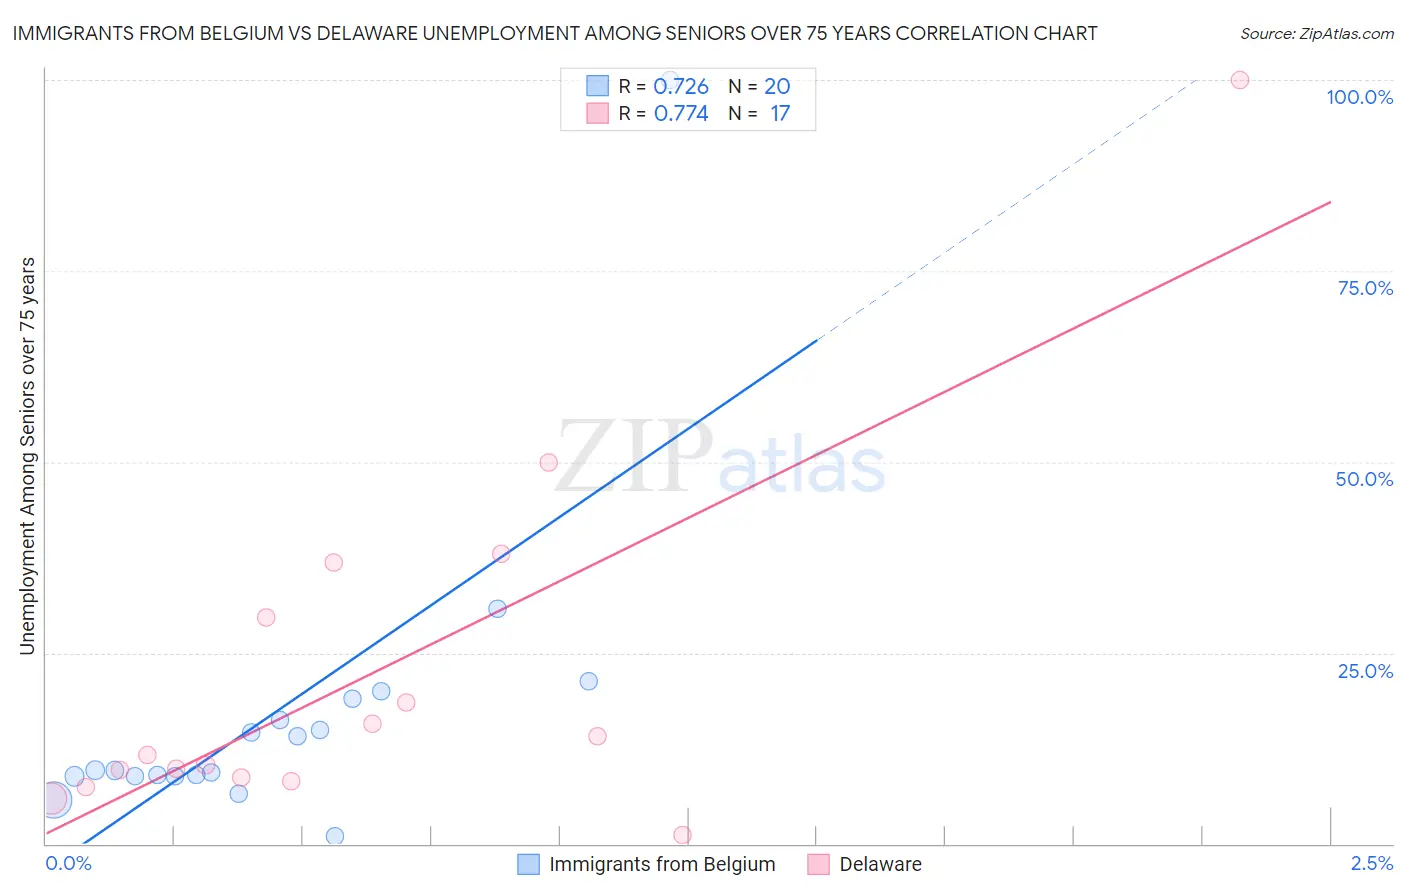
Immigrants from Belgium vs Delaware Unemployment Among Seniors over 75 years Correlation Chart
The statistical analysis conducted on geographies consisting of 103,995,962 people shows a strong positive correlation between the proportion of Immigrants from Belgium and unemployment rate among seniors over the age of 75 in the United States with a correlation coefficient (R) of 0.726 and weighted average of 8.2%. Similarly, the statistical analysis conducted on geographies consisting of 70,404,078 people shows a strong positive correlation between the proportion of Delaware and unemployment rate among seniors over the age of 75 in the United States with a correlation coefficient (R) of 0.774 and weighted average of 9.0%, a difference of 9.7%.
Unemployment Among Seniors over 75 years Correlation Summary
| Measurement | Immigrants from Belgium | Delaware |
| Minimum | 1.0% | 1.2% |
| Maximum | 100.0% | 100.0% |
| Range | 99.0% | 98.8% |
| Mean | 16.8% | 22.1% |
| Median | 9.6% | 11.7% |
| Interquartile 25% (IQ1) | 8.9% | 8.5% |
| Interquartile 75% (IQ3) | 17.5% | 33.2% |
| Interquartile Range (IQR) | 8.7% | 24.7% |
| Standard Deviation (Sample) | 20.7% | 24.2% |
| Standard Deviation (Population) | 20.1% | 23.4% |
Similar Demographics by Unemployment Among Seniors over 75 years
Demographics Similar to Immigrants from Belgium by Unemployment Among Seniors over 75 years
In terms of unemployment among seniors over 75 years, the demographic groups most similar to Immigrants from Belgium are Nicaraguan (8.2%, a difference of 0.020%), Immigrants from Sri Lanka (8.2%, a difference of 0.080%), Immigrants from Northern Africa (8.2%, a difference of 0.12%), Burmese (8.2%, a difference of 0.21%), and Immigrants from Kazakhstan (8.2%, a difference of 0.22%).
| Demographics | Rating | Rank | Unemployment Among Seniors over 75 years |
| Immigrants | Korea | 99.5 /100 | #89 | Exceptional 8.1% |
| Immigrants | Vietnam | 99.5 /100 | #90 | Exceptional 8.1% |
| Egyptians | 99.5 /100 | #91 | Exceptional 8.1% |
| Venezuelans | 99.5 /100 | #92 | Exceptional 8.1% |
| Immigrants | Netherlands | 99.5 /100 | #93 | Exceptional 8.1% |
| Immigrants | Ireland | 99.4 /100 | #94 | Exceptional 8.1% |
| Nicaraguans | 99.3 /100 | #95 | Exceptional 8.2% |
| Immigrants | Belgium | 99.3 /100 | #96 | Exceptional 8.2% |
| Immigrants | Sri Lanka | 99.3 /100 | #97 | Exceptional 8.2% |
| Immigrants | Northern Africa | 99.3 /100 | #98 | Exceptional 8.2% |
| Burmese | 99.2 /100 | #99 | Exceptional 8.2% |
| Immigrants | Kazakhstan | 99.2 /100 | #100 | Exceptional 8.2% |
| Immigrants | Serbia | 99.2 /100 | #101 | Exceptional 8.2% |
| Immigrants | Panama | 99.1 /100 | #102 | Exceptional 8.2% |
| South American Indians | 99.1 /100 | #103 | Exceptional 8.2% |
Demographics Similar to Delaware by Unemployment Among Seniors over 75 years
In terms of unemployment among seniors over 75 years, the demographic groups most similar to Delaware are Bermudan (8.9%, a difference of 0.050%), Salvadoran (8.9%, a difference of 0.080%), Romanian (9.0%, a difference of 0.080%), Immigrants from Latin America (9.0%, a difference of 0.12%), and Immigrants from Philippines (8.9%, a difference of 0.13%).
| Demographics | Rating | Rank | Unemployment Among Seniors over 75 years |
| Spaniards | 22.0 /100 | #204 | Fair 8.9% |
| Koreans | 21.9 /100 | #205 | Fair 8.9% |
| Immigrants | Western Europe | 18.2 /100 | #206 | Poor 8.9% |
| Malaysians | 16.3 /100 | #207 | Poor 8.9% |
| Immigrants | Philippines | 15.8 /100 | #208 | Poor 8.9% |
| Salvadorans | 15.4 /100 | #209 | Poor 8.9% |
| Bermudans | 15.0 /100 | #210 | Poor 8.9% |
| Delaware | 14.6 /100 | #211 | Poor 9.0% |
| Romanians | 13.8 /100 | #212 | Poor 9.0% |
| Immigrants | Latin America | 13.4 /100 | #213 | Poor 9.0% |
| Immigrants | Brazil | 13.3 /100 | #214 | Poor 9.0% |
| Immigrants | Western Asia | 12.5 /100 | #215 | Poor 9.0% |
| Immigrants | Oceania | 11.8 /100 | #216 | Poor 9.0% |
| Lebanese | 11.1 /100 | #217 | Poor 9.0% |
| Immigrants | Africa | 9.7 /100 | #218 | Tragic 9.0% |