Guatemalan vs Polish Unemployment Among Women with Children Under 6 years
COMPARE
Guatemalan
Polish
Unemployment Among Women with Children Under 6 years
Unemployment Among Women with Children Under 6 years Comparison
Guatemalans
Poles
8.7%
UNEMPLOYMENT AMONG WOMEN WITH CHILDREN UNDER 6 YEARS
0.0/ 100
METRIC RATING
281st/ 347
METRIC RANK
7.9%
UNEMPLOYMENT AMONG WOMEN WITH CHILDREN UNDER 6 YEARS
16.0/ 100
METRIC RATING
210th/ 347
METRIC RANK
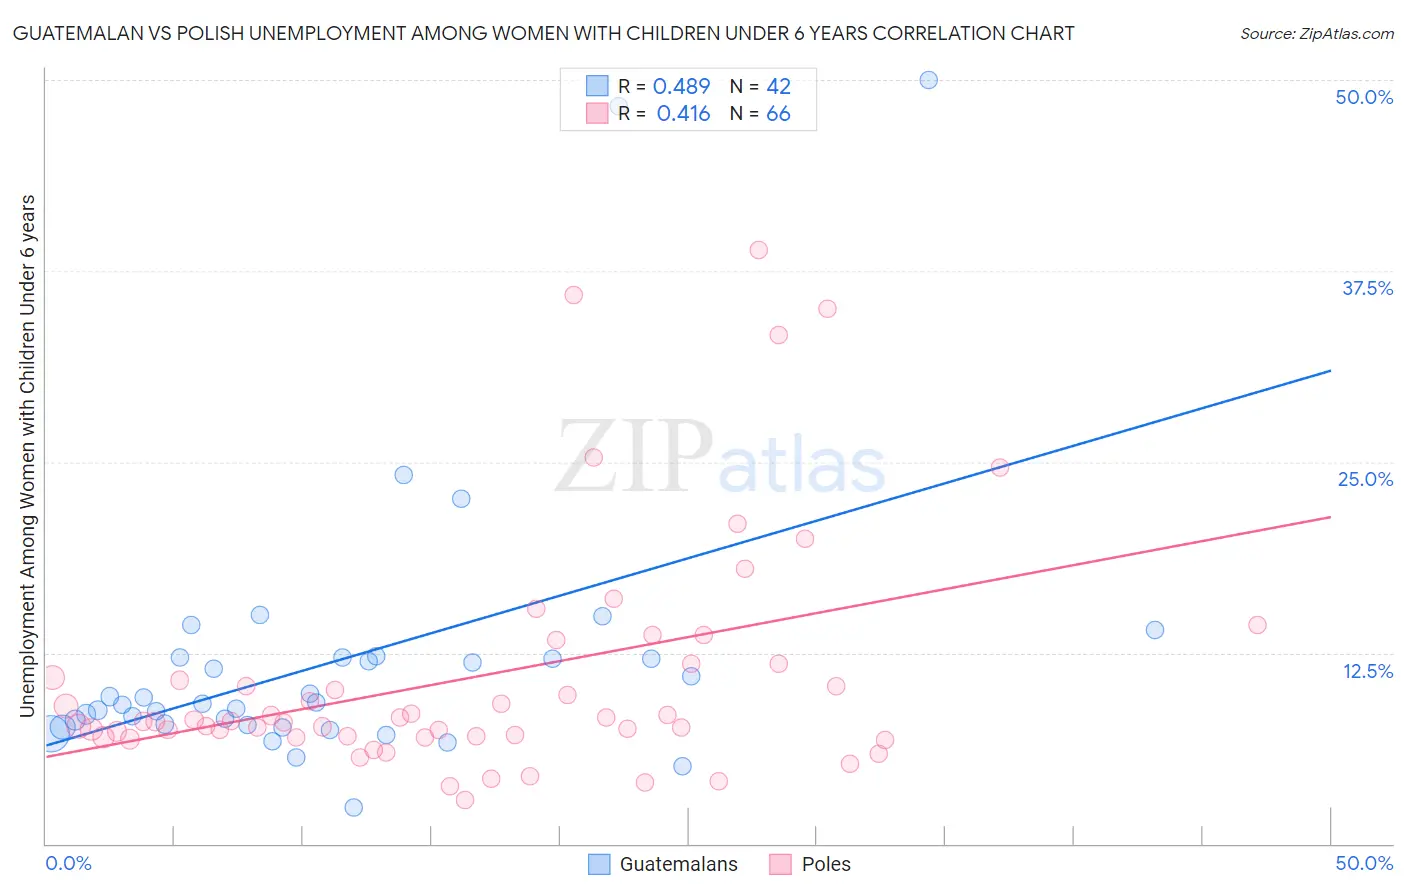
Guatemalan vs Polish Unemployment Among Women with Children Under 6 years Correlation Chart
The statistical analysis conducted on geographies consisting of 314,988,770 people shows a moderate positive correlation between the proportion of Guatemalans and unemployment rate among women with children under the age of 6 in the United States with a correlation coefficient (R) of 0.489 and weighted average of 8.7%. Similarly, the statistical analysis conducted on geographies consisting of 372,625,491 people shows a moderate positive correlation between the proportion of Poles and unemployment rate among women with children under the age of 6 in the United States with a correlation coefficient (R) of 0.416 and weighted average of 7.9%, a difference of 10.2%.
Unemployment Among Women with Children Under 6 years Correlation Summary
| Measurement | Guatemalan | Polish |
| Minimum | 2.4% | 2.8% |
| Maximum | 50.0% | 38.9% |
| Range | 47.6% | 36.0% |
| Mean | 12.0% | 11.0% |
| Median | 9.2% | 8.0% |
| Interquartile 25% (IQ1) | 7.8% | 7.1% |
| Interquartile 75% (IQ3) | 12.2% | 11.8% |
| Interquartile Range (IQR) | 4.4% | 4.7% |
| Standard Deviation (Sample) | 9.3% | 7.8% |
| Standard Deviation (Population) | 9.2% | 7.7% |
Similar Demographics by Unemployment Among Women with Children Under 6 years
Demographics Similar to Guatemalans by Unemployment Among Women with Children Under 6 years
In terms of unemployment among women with children under 6 years, the demographic groups most similar to Guatemalans are Bermudan (8.7%, a difference of 0.090%), Spanish American Indian (8.7%, a difference of 0.11%), Immigrants from Belize (8.6%, a difference of 0.14%), Immigrants from Dominica (8.6%, a difference of 0.18%), and Immigrants from Guatemala (8.6%, a difference of 0.18%).
| Demographics | Rating | Rank | Unemployment Among Women with Children Under 6 years |
| Immigrants | Cameroon | 0.1 /100 | #274 | Tragic 8.6% |
| Immigrants | Latin America | 0.1 /100 | #275 | Tragic 8.6% |
| Yaqui | 0.0 /100 | #276 | Tragic 8.6% |
| Haitians | 0.0 /100 | #277 | Tragic 8.6% |
| Immigrants | Dominica | 0.0 /100 | #278 | Tragic 8.6% |
| Immigrants | Guatemala | 0.0 /100 | #279 | Tragic 8.6% |
| Immigrants | Belize | 0.0 /100 | #280 | Tragic 8.6% |
| Guatemalans | 0.0 /100 | #281 | Tragic 8.7% |
| Bermudans | 0.0 /100 | #282 | Tragic 8.7% |
| Spanish American Indians | 0.0 /100 | #283 | Tragic 8.7% |
| Blackfeet | 0.0 /100 | #284 | Tragic 8.7% |
| U.S. Virgin Islanders | 0.0 /100 | #285 | Tragic 8.7% |
| Seminole | 0.0 /100 | #286 | Tragic 8.7% |
| Menominee | 0.0 /100 | #287 | Tragic 8.7% |
| Bahamians | 0.0 /100 | #288 | Tragic 8.7% |
Demographics Similar to Poles by Unemployment Among Women with Children Under 6 years
In terms of unemployment among women with children under 6 years, the demographic groups most similar to Poles are Immigrants from Ecuador (7.9%, a difference of 0.13%), Costa Rican (7.8%, a difference of 0.18%), Immigrants from Syria (7.8%, a difference of 0.32%), Canadian (7.8%, a difference of 0.50%), and Swiss (7.9%, a difference of 0.50%).
| Demographics | Rating | Rank | Unemployment Among Women with Children Under 6 years |
| Spaniards | 23.3 /100 | #203 | Fair 7.8% |
| Lebanese | 22.2 /100 | #204 | Fair 7.8% |
| Immigrants | Immigrants | 21.4 /100 | #205 | Fair 7.8% |
| Hungarians | 21.2 /100 | #206 | Fair 7.8% |
| Canadians | 20.6 /100 | #207 | Fair 7.8% |
| Immigrants | Syria | 18.9 /100 | #208 | Poor 7.8% |
| Costa Ricans | 17.6 /100 | #209 | Poor 7.8% |
| Poles | 16.0 /100 | #210 | Poor 7.9% |
| Immigrants | Ecuador | 14.9 /100 | #211 | Poor 7.9% |
| Swiss | 12.3 /100 | #212 | Poor 7.9% |
| Scottish | 11.4 /100 | #213 | Poor 7.9% |
| Spanish | 11.3 /100 | #214 | Poor 7.9% |
| Ecuadorians | 11.2 /100 | #215 | Poor 7.9% |
| Immigrants | Lebanon | 11.1 /100 | #216 | Poor 7.9% |
| Immigrants | Nigeria | 10.3 /100 | #217 | Poor 7.9% |