Guatemalan vs Chippewa Unemployment Among Women with Children Under 6 years
COMPARE
Guatemalan
Chippewa
Unemployment Among Women with Children Under 6 years
Unemployment Among Women with Children Under 6 years Comparison
Guatemalans
Chippewa
8.7%
UNEMPLOYMENT AMONG WOMEN WITH CHILDREN UNDER 6 YEARS
0.0/ 100
METRIC RATING
281st/ 347
METRIC RANK
13.3%
UNEMPLOYMENT AMONG WOMEN WITH CHILDREN UNDER 6 YEARS
0.0/ 100
METRIC RATING
337th/ 347
METRIC RANK
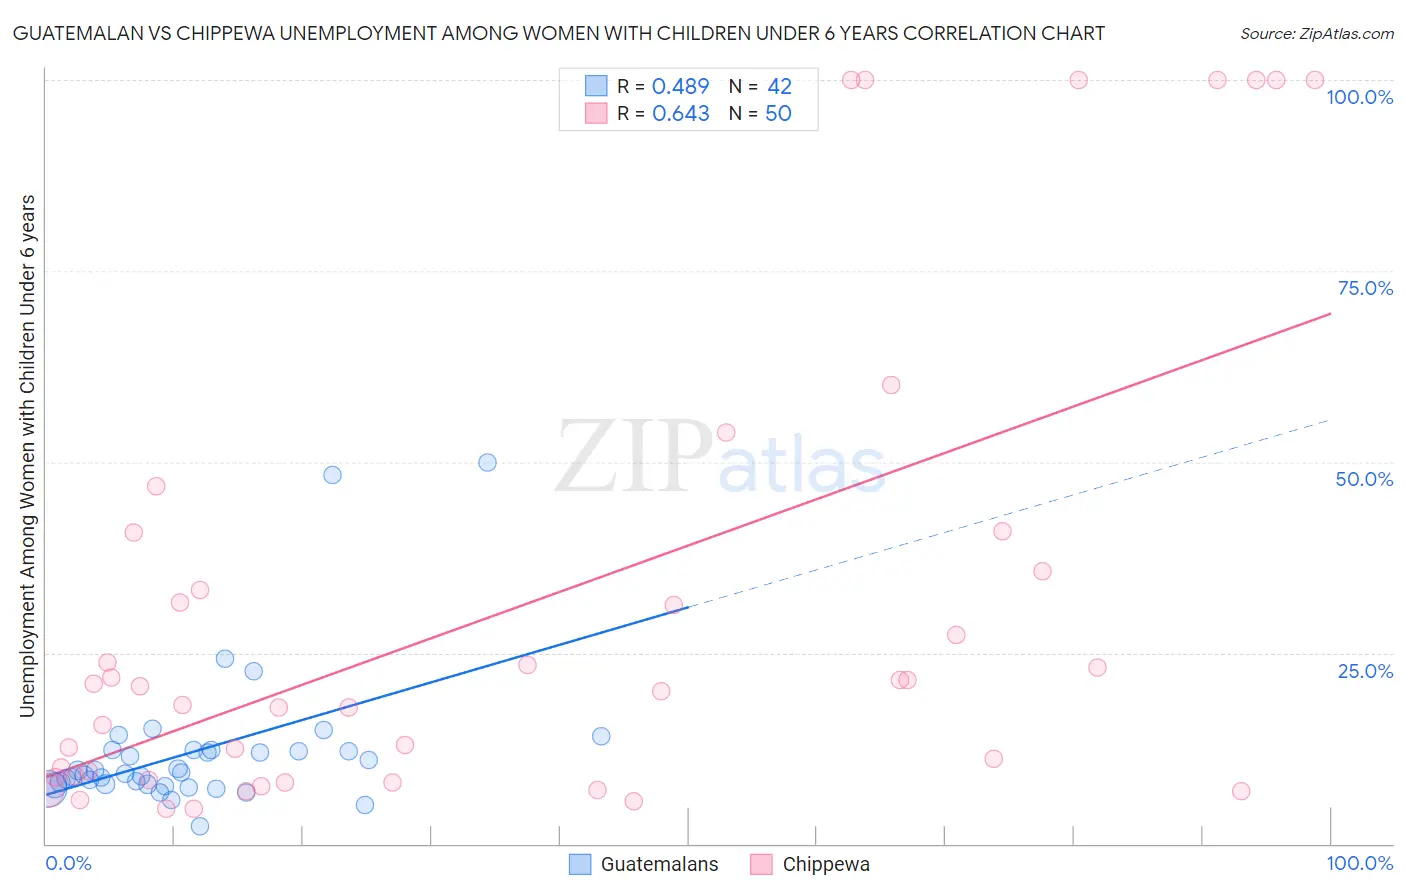
Guatemalan vs Chippewa Unemployment Among Women with Children Under 6 years Correlation Chart
The statistical analysis conducted on geographies consisting of 314,988,770 people shows a moderate positive correlation between the proportion of Guatemalans and unemployment rate among women with children under the age of 6 in the United States with a correlation coefficient (R) of 0.489 and weighted average of 8.7%. Similarly, the statistical analysis conducted on geographies consisting of 172,974,941 people shows a significant positive correlation between the proportion of Chippewa and unemployment rate among women with children under the age of 6 in the United States with a correlation coefficient (R) of 0.643 and weighted average of 13.3%, a difference of 54.0%.
Unemployment Among Women with Children Under 6 years Correlation Summary
| Measurement | Guatemalan | Chippewa |
| Minimum | 2.4% | 4.6% |
| Maximum | 50.0% | 100.0% |
| Range | 47.6% | 95.4% |
| Mean | 12.0% | 30.7% |
| Median | 9.2% | 20.3% |
| Interquartile 25% (IQ1) | 7.8% | 8.7% |
| Interquartile 75% (IQ3) | 12.2% | 35.7% |
| Interquartile Range (IQR) | 4.4% | 26.9% |
| Standard Deviation (Sample) | 9.3% | 31.0% |
| Standard Deviation (Population) | 9.2% | 30.7% |
Similar Demographics by Unemployment Among Women with Children Under 6 years
Demographics Similar to Guatemalans by Unemployment Among Women with Children Under 6 years
In terms of unemployment among women with children under 6 years, the demographic groups most similar to Guatemalans are Bermudan (8.7%, a difference of 0.090%), Spanish American Indian (8.7%, a difference of 0.11%), Immigrants from Belize (8.6%, a difference of 0.14%), Immigrants from Dominica (8.6%, a difference of 0.18%), and Immigrants from Guatemala (8.6%, a difference of 0.18%).
| Demographics | Rating | Rank | Unemployment Among Women with Children Under 6 years |
| Immigrants | Cameroon | 0.1 /100 | #274 | Tragic 8.6% |
| Immigrants | Latin America | 0.1 /100 | #275 | Tragic 8.6% |
| Yaqui | 0.0 /100 | #276 | Tragic 8.6% |
| Haitians | 0.0 /100 | #277 | Tragic 8.6% |
| Immigrants | Dominica | 0.0 /100 | #278 | Tragic 8.6% |
| Immigrants | Guatemala | 0.0 /100 | #279 | Tragic 8.6% |
| Immigrants | Belize | 0.0 /100 | #280 | Tragic 8.6% |
| Guatemalans | 0.0 /100 | #281 | Tragic 8.7% |
| Bermudans | 0.0 /100 | #282 | Tragic 8.7% |
| Spanish American Indians | 0.0 /100 | #283 | Tragic 8.7% |
| Blackfeet | 0.0 /100 | #284 | Tragic 8.7% |
| U.S. Virgin Islanders | 0.0 /100 | #285 | Tragic 8.7% |
| Seminole | 0.0 /100 | #286 | Tragic 8.7% |
| Menominee | 0.0 /100 | #287 | Tragic 8.7% |
| Bahamians | 0.0 /100 | #288 | Tragic 8.7% |
Demographics Similar to Chippewa by Unemployment Among Women with Children Under 6 years
In terms of unemployment among women with children under 6 years, the demographic groups most similar to Chippewa are Pima (13.4%, a difference of 0.79%), Shoshone (13.2%, a difference of 1.1%), Navajo (13.5%, a difference of 1.2%), Immigrants from Yemen (13.5%, a difference of 1.2%), and Lumbee (13.8%, a difference of 3.4%).
| Demographics | Rating | Rank | Unemployment Among Women with Children Under 6 years |
| Pennsylvania Germans | 0.0 /100 | #330 | Tragic 10.8% |
| Colville | 0.0 /100 | #331 | Tragic 11.2% |
| Sioux | 0.0 /100 | #332 | Tragic 11.5% |
| Natives/Alaskans | 0.0 /100 | #333 | Tragic 11.5% |
| Apache | 0.0 /100 | #334 | Tragic 12.3% |
| Puerto Ricans | 0.0 /100 | #335 | Tragic 12.5% |
| Shoshone | 0.0 /100 | #336 | Tragic 13.2% |
| Chippewa | 0.0 /100 | #337 | Tragic 13.3% |
| Pima | 0.0 /100 | #338 | Tragic 13.4% |
| Navajo | 0.0 /100 | #339 | Tragic 13.5% |
| Immigrants | Yemen | 0.0 /100 | #340 | Tragic 13.5% |
| Lumbee | 0.0 /100 | #341 | Tragic 13.8% |
| Yuman | 0.0 /100 | #342 | Tragic 14.6% |
| Crow | 0.0 /100 | #343 | Tragic 14.6% |
| Hopi | 0.0 /100 | #344 | Tragic 16.8% |