Immigrants from Eastern Africa vs Polish Unemployment Among Women with Children Under 6 years

COMPARE

Immigrants from Eastern Africa
Race
Ancestry
AfghanAfricanAlaska NativeAlaskan AthabascanAlbanianAleutAlsatianAmericanApacheArabArapahoArgentineanArmenianAssyrian/Chaldean/SyriacAustralianAustrianBahamianBangladeshiBarbadianBasqueBelgianBelizeanBermudanBhutaneseBlackfeetBolivianBrazilianBritishBritish West IndianBulgarianBurmeseCajunCambodianCanadianCape VerdeanCarpatho RusynCelticCentral AmericanCentral American IndianCherokeeCheyenneChickasawChileanChineseChippewaChoctawColombianColvilleComancheCosta RicanCreeCreekCroatianCrowCubanCypriotCzechCzechoslovakianDanishDelawareDominicanDutchDutch West IndianEastern EuropeanEcuadorianEgyptianEnglishEstonianEthiopianEuropeanFijianFilipinoFinnishFrenchFrench American IndianFrench CanadianGermanGerman RussianGhanaianGreekGuamanian/ChamorroGuatemalanGuyaneseHaitianHmongHonduranHopiHoumaHungarianIcelanderIndian (Asian)IndonesianInupiatIranianIraqiIrishIroquoisIsraeliItalianJamaicanJapaneseJordanianKenyanKiowaKoreanLaotianLatvianLebaneseLiberianLithuanianLumbeeLuxembourgerMacedonianMalaysianMalteseMarshalleseMenomineeMexicanMexican American IndianMongolianMoroccanNative HawaiianNavajoNepaleseNew ZealanderNicaraguanNigerianNorthern EuropeanNorwegianOkinawanOsageOttawaPaiutePakistaniPalestinianPanamanianParaguayanPennsylvania GermanPeruvianPimaPortuguesePotawatomiPuebloPuerto RicanPuget Sound SalishRomanianRussianSalvadoranSamoanScandinavianScotch-IrishScottishSeminoleSenegaleseSerbianShoshoneSierra LeoneanSiouxSlavicSlovakSloveneSomaliSouth AfricanSouth AmericanSouth American IndianSoviet UnionSpaniardSpanishSpanish AmericanSpanish American IndianSri LankanSubsaharan AfricanSudaneseSwedishSwissSyrianTaiwaneseThaiTlingit-HaidaTohono O'OdhamTonganTrinidadian and TobagonianTsimshianTurkishU.S. Virgin IslanderUgandanUkrainianUruguayanUteVenezuelanVietnameseWelshWest IndianYakamaYaquiYugoslavianYumanYup'ikZimbabwean
Immigration
NonimmigrantsImmigrantsAfghanistanAfricaAlbaniaArgentinaArmeniaAsiaAustraliaAustriaBahamasBangladeshBarbadosBelarusBelgiumBelizeBoliviaBosnia and HerzegovinaBrazilBulgariaBurma/MyanmarCabo VerdeCambodiaCameroonCanadaCaribbeanCentral AmericaChileChinaColombiaCongoCosta RicaCroatiaCubaCzechoslovakiaDenmarkDominicaDominican RepublicEastern AfricaEastern AsiaEastern EuropeEcuadorEgyptEl SalvadorEnglandEritreaEthiopiaEuropeFijiFranceGermanyGhanaGreeceGrenadaGuatemalaGuyanaHaitiHondurasHong KongHungaryIndiaIndonesiaIranIraqIrelandIsraelItalyJamaicaJapanJordanKazakhstanKenyaKoreaKuwaitLaosLatin AmericaLatviaLebanonLiberiaLithuaniaMalaysiaMexicoMicronesiaMiddle AfricaMoldovaMoroccoNepalNetherlandsNicaraguaNigeriaNorth AmericaNorth MacedoniaNorthern AfricaNorthern EuropeNorwayOceaniaPakistanPanamaPeruPhilippinesPolandPortugalRomaniaRussiaSaudi ArabiaScotlandSenegalSerbiaSierra LeoneSingaporeSomaliaSouth AfricaSouth AmericaSouth Central AsiaSouth Eastern AsiaSouthern EuropeSpainSri LankaSt. Vincent and the GrenadinesSudanSwedenSwitzerlandSyriaTaiwanThailandTrinidad and TobagoTurkeyUgandaUkraineUruguayUzbekistanVenezuelaVietnamWest IndiesWestern AfricaWestern AsiaWestern EuropeYemenZaireZimbabweAzores
Polish
Race
Ancestry
AfghanAfricanAlaska NativeAlaskan AthabascanAlbanianAleutAlsatianAmericanApacheArabArapahoArgentineanArmenianAssyrian/Chaldean/SyriacAustralianAustrianBahamianBangladeshiBarbadianBasqueBelgianBelizeanBermudanBhutaneseBlackfeetBolivianBrazilianBritishBritish West IndianBulgarianBurmeseCajunCambodianCanadianCape VerdeanCarpatho RusynCelticCentral AmericanCentral American IndianCherokeeCheyenneChickasawChileanChineseChippewaChoctawColombianColvilleComancheCosta RicanCreeCreekCroatianCrowCubanCypriotCzechCzechoslovakianDanishDelawareDominicanDutchDutch West IndianEastern EuropeanEcuadorianEgyptianEnglishEstonianEthiopianEuropeanFijianFilipinoFinnishFrenchFrench American IndianFrench CanadianGermanGerman RussianGhanaianGreekGuamanian/ChamorroGuatemalanGuyaneseHaitianHmongHonduranHopiHoumaHungarianIcelanderIndian (Asian)IndonesianInupiatIranianIraqiIrishIroquoisIsraeliItalianJamaicanJapaneseJordanianKenyanKiowaKoreanLaotianLatvianLebaneseLiberianLithuanianLumbeeLuxembourgerMacedonianMalaysianMalteseMarshalleseMenomineeMexicanMexican American IndianMongolianMoroccanNative HawaiianNavajoNepaleseNew ZealanderNicaraguanNigerianNorthern EuropeanNorwegianOkinawanOsageOttawaPaiutePakistaniPalestinianPanamanianParaguayanPennsylvania GermanPeruvianPimaPolishPortuguesePotawatomiPuebloPuerto RicanPuget Sound SalishRomanianRussianSalvadoranSamoanScandinavianScotch-IrishScottishSeminoleSenegaleseSerbianShoshoneSierra LeoneanSiouxSlavicSlovakSloveneSomaliSouth AfricanSouth AmericanSouth American IndianSoviet UnionSpaniardSpanishSpanish AmericanSpanish American IndianSri LankanSubsaharan AfricanSudaneseSwedishSwissSyrianTaiwaneseThaiTlingit-HaidaTohono O'OdhamTonganTrinidadian and TobagonianTsimshianTurkishU.S. Virgin IslanderUgandanUkrainianUruguayanUteVenezuelanVietnameseWelshWest IndianYakamaYaquiYugoslavianYumanYup'ikZimbabwean
Immigration
NonimmigrantsImmigrantsAfghanistanAfricaAlbaniaArgentinaArmeniaAsiaAustraliaAustriaBahamasBangladeshBarbadosBelarusBelgiumBelizeBoliviaBosnia and HerzegovinaBrazilBulgariaBurma/MyanmarCabo VerdeCambodiaCameroonCanadaCaribbeanCentral AmericaChileChinaColombiaCongoCosta RicaCroatiaCubaCzechoslovakiaDenmarkDominicaDominican RepublicEastern AsiaEastern EuropeEcuadorEgyptEl SalvadorEnglandEritreaEthiopiaEuropeFijiFranceGermanyGhanaGreeceGrenadaGuatemalaGuyanaHaitiHondurasHong KongHungaryIndiaIndonesiaIranIraqIrelandIsraelItalyJamaicaJapanJordanKazakhstanKenyaKoreaKuwaitLaosLatin AmericaLatviaLebanonLiberiaLithuaniaMalaysiaMexicoMicronesiaMiddle AfricaMoldovaMoroccoNepalNetherlandsNicaraguaNigeriaNorth AmericaNorth MacedoniaNorthern AfricaNorthern EuropeNorwayOceaniaPakistanPanamaPeruPhilippinesPolandPortugalRomaniaRussiaSaudi ArabiaScotlandSenegalSerbiaSierra LeoneSingaporeSomaliaSouth AfricaSouth AmericaSouth Central AsiaSouth Eastern AsiaSouthern EuropeSpainSri LankaSt. Vincent and the GrenadinesSudanSwedenSwitzerlandSyriaTaiwanThailandTrinidad and TobagoTurkeyUgandaUkraineUruguayUzbekistanVenezuelaVietnamWest IndiesWestern AfricaWestern AsiaWestern EuropeYemenZaireZimbabweAzores
Unemployment Among Women with Children Under 6 years
Income
Poverty
Unemployment
Labor Participation
Family Structure
Vehicle Availability
Education Level
Disability

Unemployment Among Women with Children Under 6 years Comparison

Immigrants from Eastern Africa

Poles

Exceptional
Poor
7.2%
UNEMPLOYMENT AMONG WOMEN WITH CHILDREN UNDER 6 YEARS
97.7/ 100
METRIC RATING
96th/ 347
METRIC RANK
7.9%
UNEMPLOYMENT AMONG WOMEN WITH CHILDREN UNDER 6 YEARS
16.0/ 100
METRIC RATING
210th/ 347
METRIC RANK

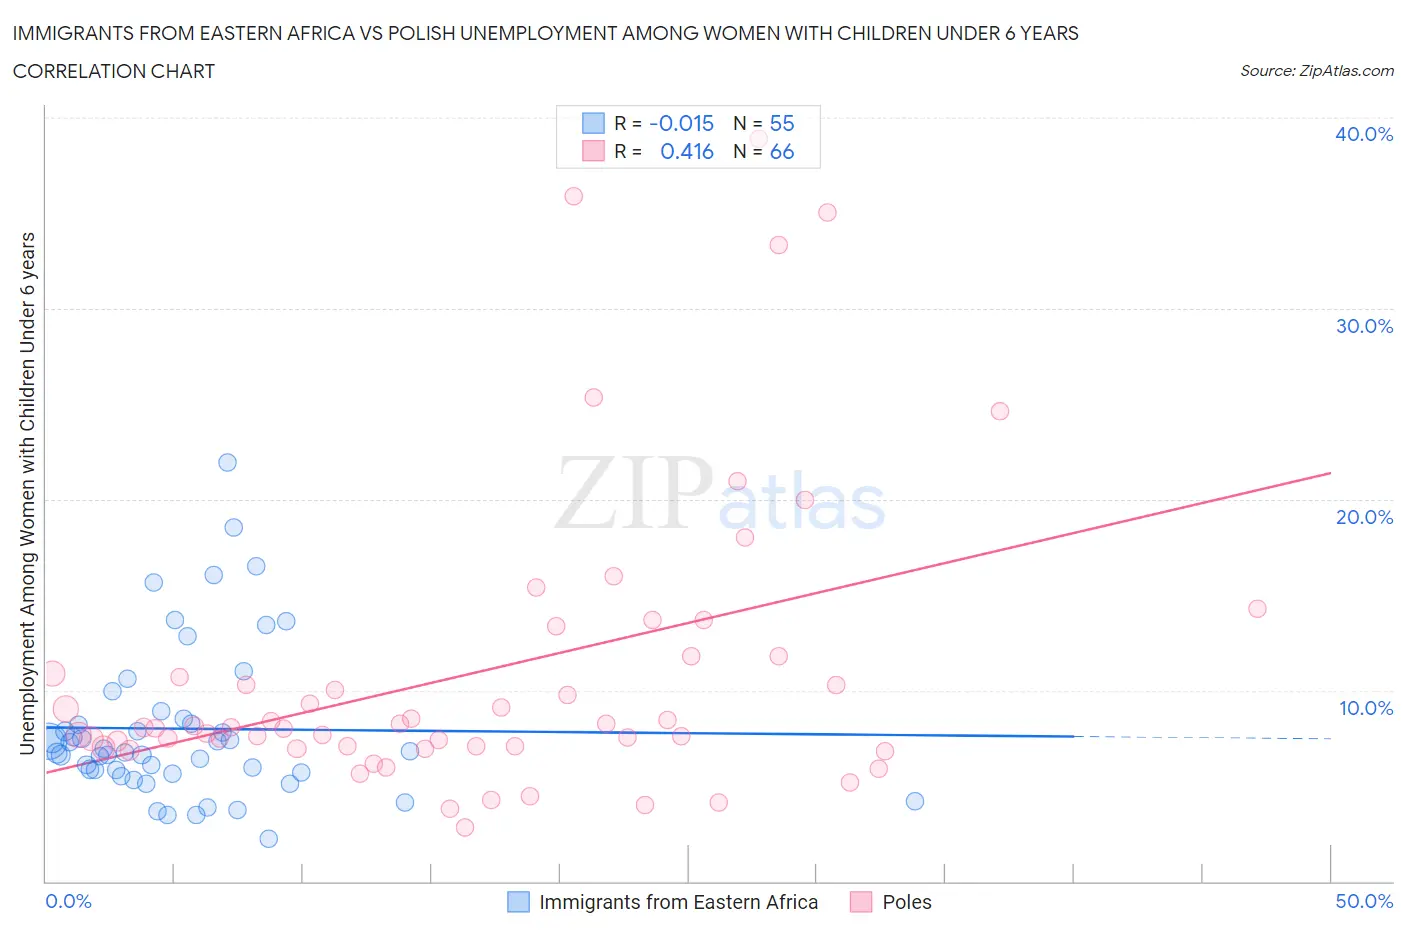
Immigrants from Eastern Africa vs Polish Unemployment Among Women with Children Under 6 years Correlation Chart

The statistical analysis conducted on geographies consisting of 280,421,039 people shows no correlation between the proportion of Immigrants from Eastern Africa and unemployment rate among women with children under the age of 6 in the United States with a correlation coefficient (R) of -0.015 and weighted average of 7.2%. Similarly, the statistical analysis conducted on geographies consisting of 372,625,491 people shows a moderate positive correlation between the proportion of Poles and unemployment rate among women with children under the age of 6 in the United States with a correlation coefficient (R) of 0.416 and weighted average of 7.9%, a difference of 9.5%.
Immigrants from Eastern Africa vs Polish Unemployment Among Women with Children Under 6 years

Unemployment Among Women with Children Under 6 years Correlation Summary

MeasurementImmigrants from Eastern AfricaPolish
Minimum2.2%2.8%
Maximum22.0%38.9%
Range19.8%36.0%
Mean8.0%11.0%
Median6.8%8.0%
Interquartile 25% (IQ1)5.7%7.1%
Interquartile 75% (IQ3)8.5%11.8%
Interquartile Range (IQR)2.8%4.7%
Standard Deviation (Sample)4.0%7.8%
Standard Deviation (Population)4.0%7.7%

Similar Demographics by Unemployment Among Women with Children Under 6 years

Demographics Similar to Immigrants from Eastern Africa by Unemployment Among Women with Children Under 6 years

In terms of unemployment among women with children under 6 years, the demographic groups most similar to Immigrants from Eastern Africa are Romanian (7.2%, a difference of 0.010%), Macedonian (7.2%, a difference of 0.060%), Immigrants from South Eastern Asia (7.2%, a difference of 0.080%), Russian (7.2%, a difference of 0.11%), and New Zealander (7.2%, a difference of 0.13%).
DemographicsRating | RankUnemployment Among Women with Children Under 6 years
Immigrants | Denmark
98.3
/100
|
#89
Exceptional
7.1%
Immigrants | Spain
98.2
/100
|
#90
Exceptional
7.1%
Danes
98.2
/100
|
#91
Exceptional
7.1%
Albanians
98.0
/100
|
#92
Exceptional
7.2%
New Zealanders
97.8
/100
|
#93
Exceptional
7.2%
Macedonians
97.7
/100
|
#94
Exceptional
7.2%
Romanians
97.7
/100
|
#95
Exceptional
7.2%
Immigrants | Eastern Africa
97.7
/100
|
#96
Exceptional
7.2%
Immigrants | South Eastern Asia
97.6
/100
|
#97
Exceptional
7.2%
Russians
97.5
/100
|
#98
Exceptional
7.2%
Immigrants | Europe
97.5
/100
|
#99
Exceptional
7.2%
Immigrants | Northern Europe
97.4
/100
|
#100
Exceptional
7.2%
Chileans
97.4
/100
|
#101
Exceptional
7.2%
Immigrants | Nicaragua
97.3
/100
|
#102
Exceptional
7.2%
Immigrants | Saudi Arabia
97.3
/100
|
#103
Exceptional
7.2%

Demographics Similar to Poles by Unemployment Among Women with Children Under 6 years

In terms of unemployment among women with children under 6 years, the demographic groups most similar to Poles are Immigrants from Ecuador (7.9%, a difference of 0.13%), Costa Rican (7.8%, a difference of 0.18%), Immigrants from Syria (7.8%, a difference of 0.32%), Canadian (7.8%, a difference of 0.50%), and Swiss (7.9%, a difference of 0.50%).
DemographicsRating | RankUnemployment Among Women with Children Under 6 years
Spaniards
23.3
/100
|
#203
Fair
7.8%
Lebanese
22.2
/100
|
#204
Fair
7.8%
Immigrants | Immigrants
21.4
/100
|
#205
Fair
7.8%
Hungarians
21.2
/100
|
#206
Fair
7.8%
Canadians
20.6
/100
|
#207
Fair
7.8%
Immigrants | Syria
18.9
/100
|
#208
Poor
7.8%
Costa Ricans
17.6
/100
|
#209
Poor
7.8%
Poles
16.0
/100
|
#210
Poor
7.9%
Immigrants | Ecuador
14.9
/100
|
#211
Poor
7.9%
Swiss
12.3
/100
|
#212
Poor
7.9%
Scottish
11.4
/100
|
#213
Poor
7.9%
Spanish
11.3
/100
|
#214
Poor
7.9%
Ecuadorians
11.2
/100
|
#215
Poor
7.9%
Immigrants | Lebanon
11.1
/100
|
#216
Poor
7.9%
Immigrants | Nigeria
10.3
/100
|
#217
Poor
7.9%