Guatemalan vs French Canadian Unemployment Among Women with Children Under 6 years
COMPARE
Guatemalan
French Canadian
Unemployment Among Women with Children Under 6 years
Unemployment Among Women with Children Under 6 years Comparison
Guatemalans
French Canadians
8.7%
UNEMPLOYMENT AMONG WOMEN WITH CHILDREN UNDER 6 YEARS
0.0/ 100
METRIC RATING
281st/ 347
METRIC RANK
8.4%
UNEMPLOYMENT AMONG WOMEN WITH CHILDREN UNDER 6 YEARS
0.3/ 100
METRIC RATING
265th/ 347
METRIC RANK
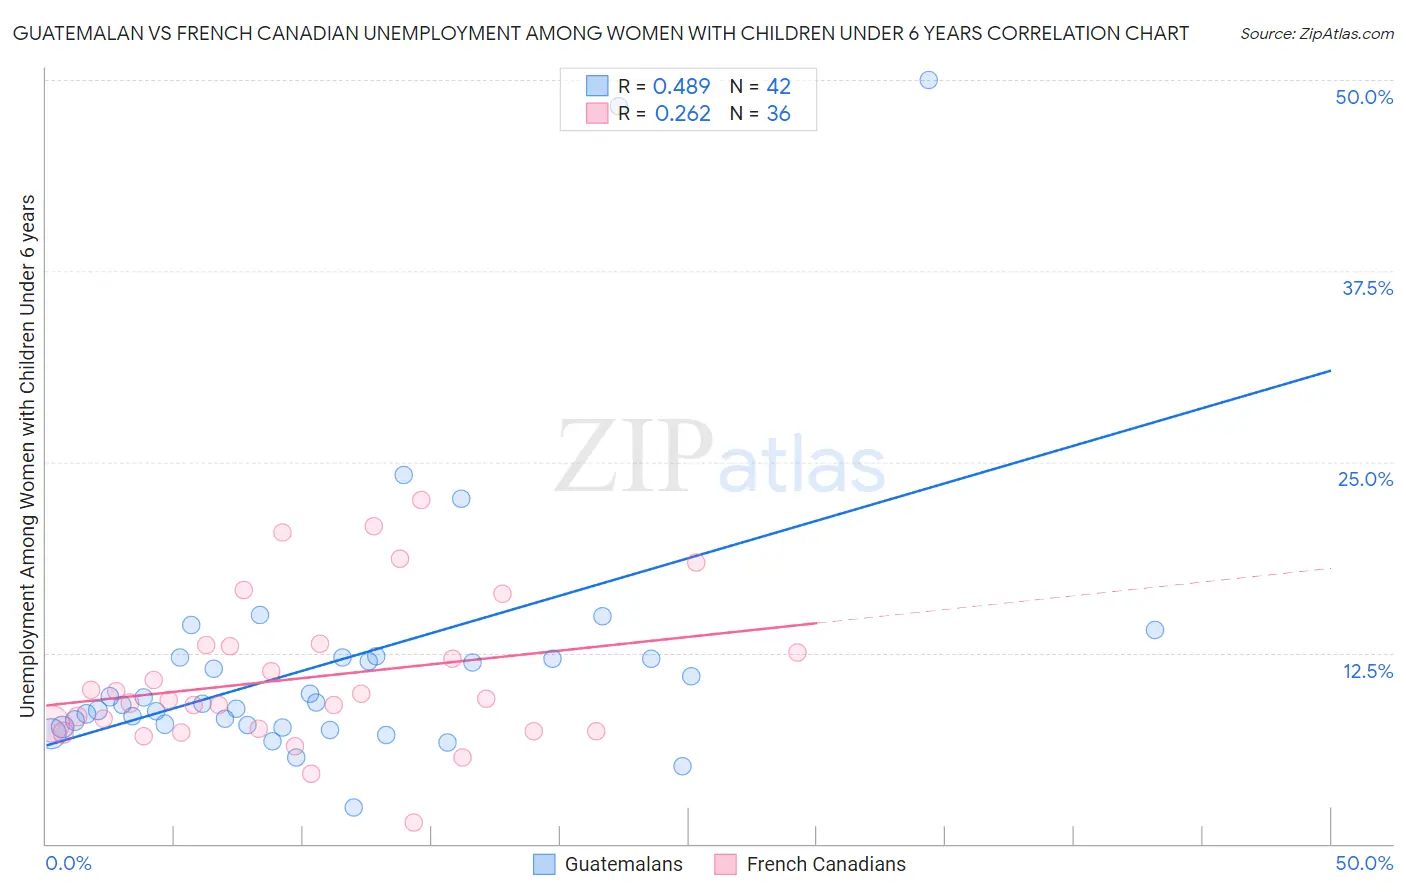
Guatemalan vs French Canadian Unemployment Among Women with Children Under 6 years Correlation Chart
The statistical analysis conducted on geographies consisting of 314,988,770 people shows a moderate positive correlation between the proportion of Guatemalans and unemployment rate among women with children under the age of 6 in the United States with a correlation coefficient (R) of 0.489 and weighted average of 8.7%. Similarly, the statistical analysis conducted on geographies consisting of 347,734,742 people shows a weak positive correlation between the proportion of French Canadians and unemployment rate among women with children under the age of 6 in the United States with a correlation coefficient (R) of 0.262 and weighted average of 8.4%, a difference of 3.1%.
Unemployment Among Women with Children Under 6 years Correlation Summary
| Measurement | Guatemalan | French Canadian |
| Minimum | 2.4% | 1.4% |
| Maximum | 50.0% | 22.5% |
| Range | 47.6% | 21.1% |
| Mean | 12.0% | 10.9% |
| Median | 9.2% | 9.4% |
| Interquartile 25% (IQ1) | 7.8% | 7.4% |
| Interquartile 75% (IQ3) | 12.2% | 13.0% |
| Interquartile Range (IQR) | 4.4% | 5.5% |
| Standard Deviation (Sample) | 9.3% | 4.8% |
| Standard Deviation (Population) | 9.2% | 4.8% |
Demographics Similar to Guatemalans and French Canadians by Unemployment Among Women with Children Under 6 years
In terms of unemployment among women with children under 6 years, the demographic groups most similar to Guatemalans are Bermudan (8.7%, a difference of 0.090%), Spanish American Indian (8.7%, a difference of 0.11%), Immigrants from Belize (8.6%, a difference of 0.14%), Immigrants from Dominica (8.6%, a difference of 0.18%), and Immigrants from Guatemala (8.6%, a difference of 0.18%). Similarly, the demographic groups most similar to French Canadians are Immigrants from Honduras (8.4%, a difference of 0.0%), Honduran (8.4%, a difference of 0.050%), Scotch-Irish (8.4%, a difference of 0.070%), Belizean (8.4%, a difference of 0.27%), and Subsaharan African (8.4%, a difference of 0.37%).
| Demographics | Rating | Rank | Unemployment Among Women with Children Under 6 years |
| Scotch-Irish | 0.3 /100 | #263 | Tragic 8.4% |
| Hondurans | 0.3 /100 | #264 | Tragic 8.4% |
| French Canadians | 0.3 /100 | #265 | Tragic 8.4% |
| Immigrants | Honduras | 0.3 /100 | #266 | Tragic 8.4% |
| Belizeans | 0.2 /100 | #267 | Tragic 8.4% |
| Sub-Saharan Africans | 0.2 /100 | #268 | Tragic 8.4% |
| Immigrants | Haiti | 0.2 /100 | #269 | Tragic 8.4% |
| Immigrants | Senegal | 0.2 /100 | #270 | Tragic 8.5% |
| Immigrants | Congo | 0.2 /100 | #271 | Tragic 8.5% |
| Mexican American Indians | 0.1 /100 | #272 | Tragic 8.5% |
| Slovaks | 0.1 /100 | #273 | Tragic 8.5% |
| Immigrants | Cameroon | 0.1 /100 | #274 | Tragic 8.6% |
| Immigrants | Latin America | 0.1 /100 | #275 | Tragic 8.6% |
| Yaqui | 0.0 /100 | #276 | Tragic 8.6% |
| Haitians | 0.0 /100 | #277 | Tragic 8.6% |
| Immigrants | Dominica | 0.0 /100 | #278 | Tragic 8.6% |
| Immigrants | Guatemala | 0.0 /100 | #279 | Tragic 8.6% |
| Immigrants | Belize | 0.0 /100 | #280 | Tragic 8.6% |
| Guatemalans | 0.0 /100 | #281 | Tragic 8.7% |
| Bermudans | 0.0 /100 | #282 | Tragic 8.7% |
| Spanish American Indians | 0.0 /100 | #283 | Tragic 8.7% |