Guatemalan vs Immigrants from West Indies Unemployment
COMPARE
Guatemalan
Immigrants from West Indies
Unemployment
Unemployment Comparison
Guatemalans
Immigrants from West Indies
5.8%
UNEMPLOYMENT
0.2/ 100
METRIC RATING
256th/ 347
METRIC RANK
6.3%
UNEMPLOYMENT
0.0/ 100
METRIC RATING
299th/ 347
METRIC RANK
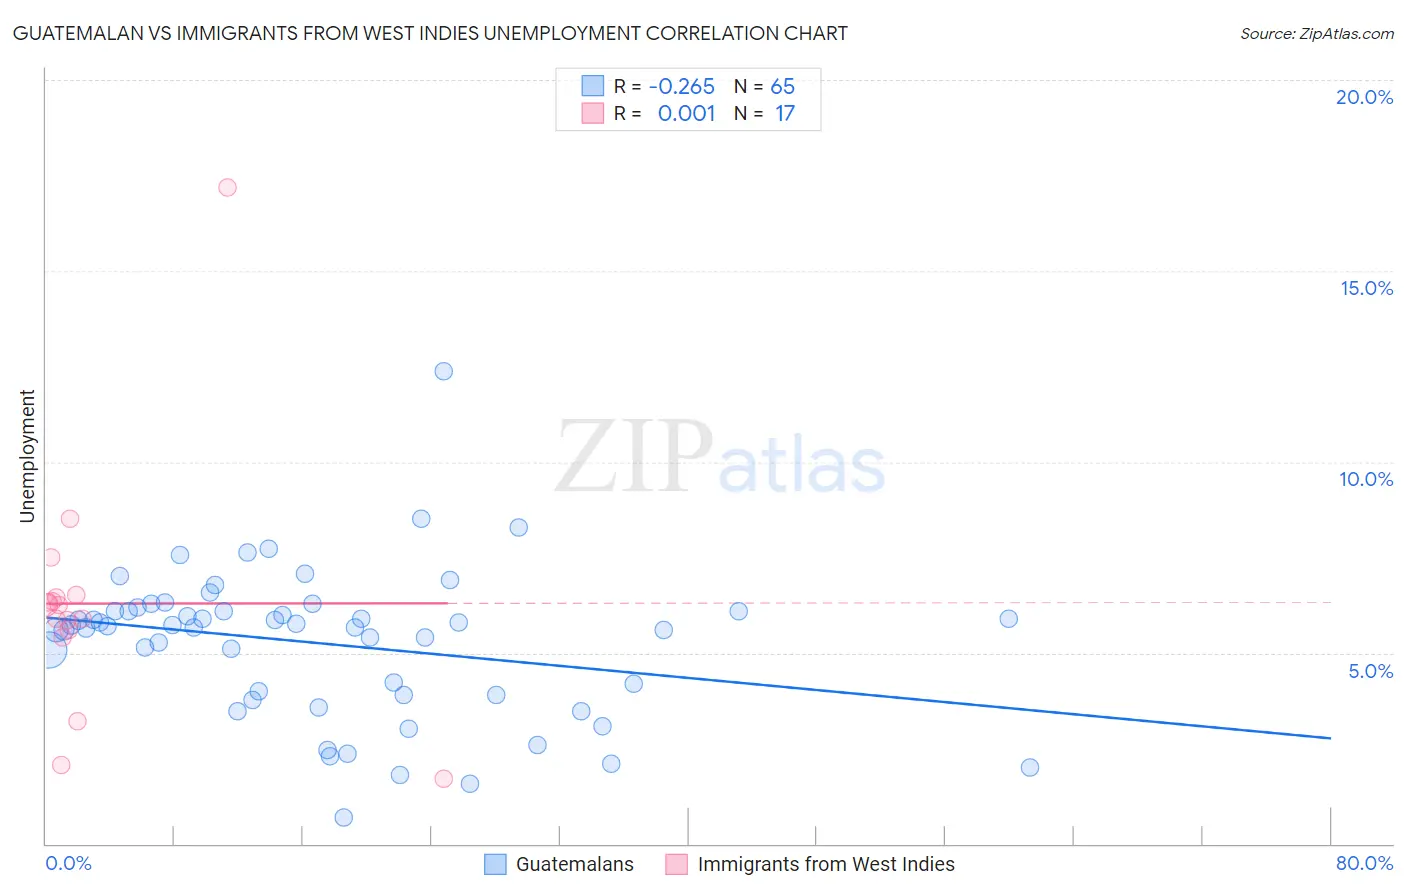
Guatemalan vs Immigrants from West Indies Unemployment Correlation Chart
The statistical analysis conducted on geographies consisting of 409,136,964 people shows a weak negative correlation between the proportion of Guatemalans and unemployment in the United States with a correlation coefficient (R) of -0.265 and weighted average of 5.8%. Similarly, the statistical analysis conducted on geographies consisting of 72,442,388 people shows no correlation between the proportion of Immigrants from West Indies and unemployment in the United States with a correlation coefficient (R) of 0.001 and weighted average of 6.3%, a difference of 9.5%.
Unemployment Correlation Summary
| Measurement | Guatemalan | Immigrants from West Indies |
| Minimum | 0.70% | 1.7% |
| Maximum | 12.4% | 17.2% |
| Range | 11.7% | 15.5% |
| Mean | 5.2% | 6.3% |
| Median | 5.7% | 6.2% |
| Interquartile 25% (IQ1) | 3.9% | 5.5% |
| Interquartile 75% (IQ3) | 6.1% | 6.5% |
| Interquartile Range (IQR) | 2.2% | 0.97% |
| Standard Deviation (Sample) | 1.9% | 3.3% |
| Standard Deviation (Population) | 1.9% | 3.2% |
Similar Demographics by Unemployment
Demographics Similar to Guatemalans by Unemployment
In terms of unemployment, the demographic groups most similar to Guatemalans are Immigrants from Portugal (5.7%, a difference of 0.21%), Yaqui (5.8%, a difference of 0.30%), Immigrants from Bahamas (5.8%, a difference of 0.44%), Subsaharan African (5.8%, a difference of 0.56%), and Immigrants from Uzbekistan (5.8%, a difference of 0.58%).
| Demographics | Rating | Rank | Unemployment |
| Cajuns | 0.8 /100 | #249 | Tragic 5.6% |
| Japanese | 0.8 /100 | #250 | Tragic 5.6% |
| Kiowa | 0.6 /100 | #251 | Tragic 5.7% |
| Hondurans | 0.3 /100 | #252 | Tragic 5.7% |
| Central Americans | 0.3 /100 | #253 | Tragic 5.7% |
| Immigrants | Honduras | 0.3 /100 | #254 | Tragic 5.7% |
| Immigrants | Portugal | 0.2 /100 | #255 | Tragic 5.7% |
| Guatemalans | 0.2 /100 | #256 | Tragic 5.8% |
| Yaqui | 0.2 /100 | #257 | Tragic 5.8% |
| Immigrants | Bahamas | 0.1 /100 | #258 | Tragic 5.8% |
| Sub-Saharan Africans | 0.1 /100 | #259 | Tragic 5.8% |
| Immigrants | Uzbekistan | 0.1 /100 | #260 | Tragic 5.8% |
| Immigrants | Guatemala | 0.1 /100 | #261 | Tragic 5.8% |
| Sierra Leoneans | 0.1 /100 | #262 | Tragic 5.8% |
| Salvadorans | 0.1 /100 | #263 | Tragic 5.8% |
Demographics Similar to Immigrants from West Indies by Unemployment
In terms of unemployment, the demographic groups most similar to Immigrants from West Indies are Immigrants from Haiti (6.3%, a difference of 0.050%), Immigrants from Trinidad and Tobago (6.3%, a difference of 0.12%), Jamaican (6.3%, a difference of 0.14%), Ute (6.3%, a difference of 0.48%), and Trinidadian and Tobagonian (6.3%, a difference of 0.60%).
| Demographics | Rating | Rank | Unemployment |
| Central American Indians | 0.0 /100 | #292 | Tragic 6.2% |
| Immigrants | Ecuador | 0.0 /100 | #293 | Tragic 6.2% |
| Spanish American Indians | 0.0 /100 | #294 | Tragic 6.2% |
| U.S. Virgin Islanders | 0.0 /100 | #295 | Tragic 6.3% |
| Ute | 0.0 /100 | #296 | Tragic 6.3% |
| Jamaicans | 0.0 /100 | #297 | Tragic 6.3% |
| Immigrants | Haiti | 0.0 /100 | #298 | Tragic 6.3% |
| Immigrants | West Indies | 0.0 /100 | #299 | Tragic 6.3% |
| Immigrants | Trinidad and Tobago | 0.0 /100 | #300 | Tragic 6.3% |
| Trinidadians and Tobagonians | 0.0 /100 | #301 | Tragic 6.3% |
| West Indians | 0.0 /100 | #302 | Tragic 6.4% |
| Belizeans | 0.0 /100 | #303 | Tragic 6.4% |
| Immigrants | Jamaica | 0.0 /100 | #304 | Tragic 6.4% |
| Menominee | 0.0 /100 | #305 | Tragic 6.4% |
| Lumbee | 0.0 /100 | #306 | Tragic 6.4% |