Guatemalan vs Palestinian Male Unemployment
COMPARE
Guatemalan
Palestinian
Male Unemployment
Male Unemployment Comparison
Guatemalans
Palestinians
5.6%
MALE UNEMPLOYMENT
1.2/ 100
METRIC RATING
236th/ 347
METRIC RANK
5.1%
MALE UNEMPLOYMENT
87.7/ 100
METRIC RATING
123rd/ 347
METRIC RANK
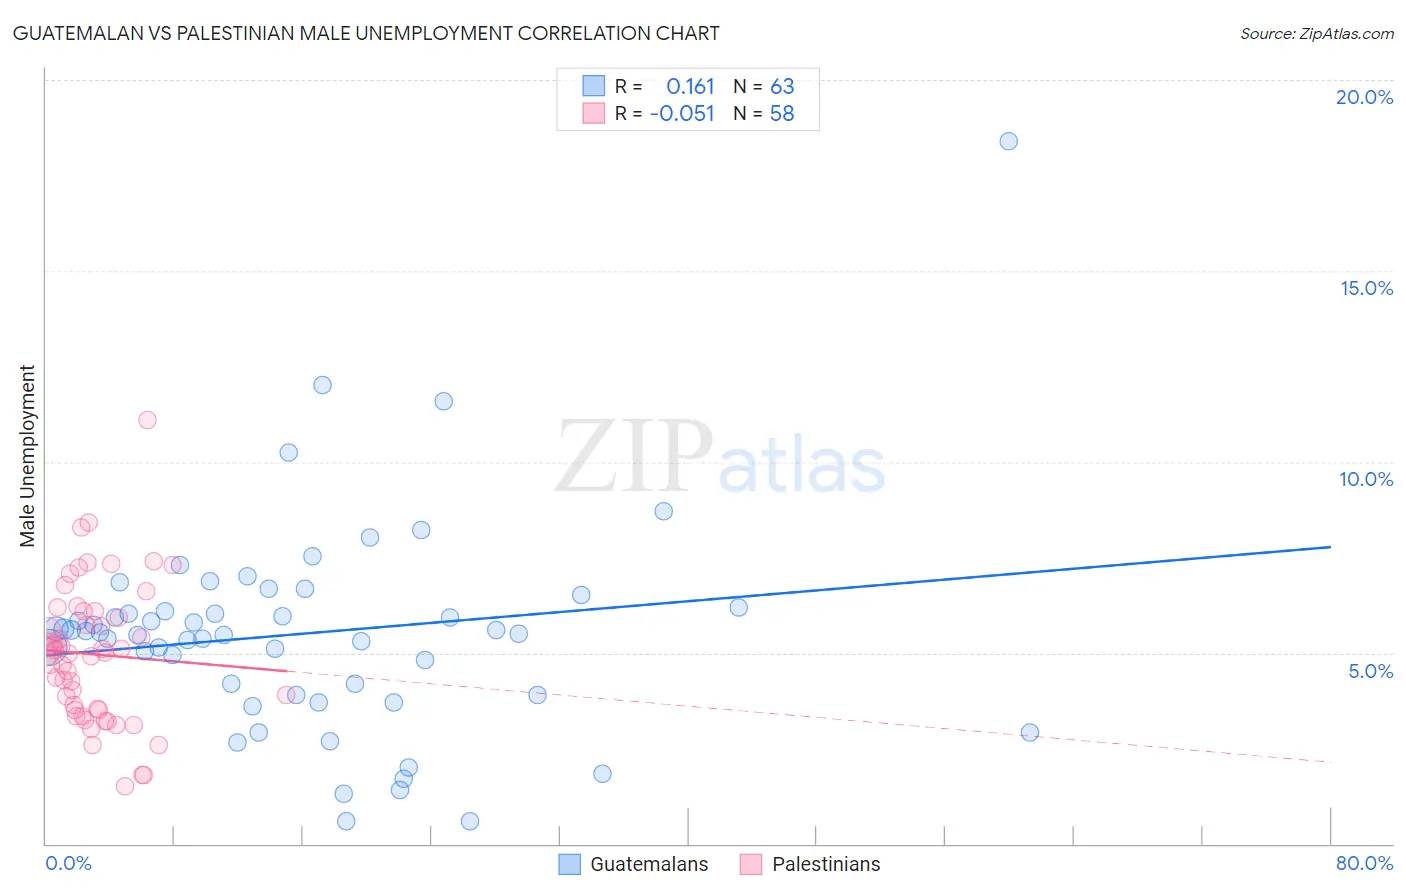
Guatemalan vs Palestinian Male Unemployment Correlation Chart
The statistical analysis conducted on geographies consisting of 407,851,547 people shows a poor positive correlation between the proportion of Guatemalans and unemployment rate among males in the United States with a correlation coefficient (R) of 0.161 and weighted average of 5.6%. Similarly, the statistical analysis conducted on geographies consisting of 216,271,128 people shows a slight negative correlation between the proportion of Palestinians and unemployment rate among males in the United States with a correlation coefficient (R) of -0.051 and weighted average of 5.1%, a difference of 9.6%.
Male Unemployment Correlation Summary
| Measurement | Guatemalan | Palestinian |
| Minimum | 0.60% | 1.5% |
| Maximum | 18.4% | 11.1% |
| Range | 17.8% | 9.6% |
| Mean | 5.5% | 5.0% |
| Median | 5.5% | 5.0% |
| Interquartile 25% (IQ1) | 3.9% | 3.5% |
| Interquartile 75% (IQ3) | 6.2% | 6.1% |
| Interquartile Range (IQR) | 2.3% | 2.6% |
| Standard Deviation (Sample) | 2.8% | 1.8% |
| Standard Deviation (Population) | 2.8% | 1.8% |
Similar Demographics by Male Unemployment
Demographics Similar to Guatemalans by Male Unemployment
In terms of male unemployment, the demographic groups most similar to Guatemalans are Honduran (5.6%, a difference of 0.090%), Native Hawaiian (5.6%, a difference of 0.14%), Immigrants from Guatemala (5.6%, a difference of 0.14%), Immigrants from Cameroon (5.6%, a difference of 0.21%), and Salvadoran (5.7%, a difference of 0.25%).
| Demographics | Rating | Rank | Male Unemployment |
| Central Americans | 1.8 /100 | #229 | Tragic 5.6% |
| Immigrants | Africa | 1.7 /100 | #230 | Tragic 5.6% |
| Choctaw | 1.6 /100 | #231 | Tragic 5.6% |
| Moroccans | 1.6 /100 | #232 | Tragic 5.6% |
| Somalis | 1.5 /100 | #233 | Tragic 5.6% |
| Immigrants | Somalia | 1.5 /100 | #234 | Tragic 5.6% |
| Immigrants | Honduras | 1.5 /100 | #235 | Tragic 5.6% |
| Guatemalans | 1.2 /100 | #236 | Tragic 5.6% |
| Hondurans | 1.1 /100 | #237 | Tragic 5.6% |
| Native Hawaiians | 1.1 /100 | #238 | Tragic 5.6% |
| Immigrants | Guatemala | 1.1 /100 | #239 | Tragic 5.6% |
| Immigrants | Cameroon | 1.0 /100 | #240 | Tragic 5.6% |
| Salvadorans | 1.0 /100 | #241 | Tragic 5.7% |
| Ottawa | 0.9 /100 | #242 | Tragic 5.7% |
| Bangladeshis | 0.8 /100 | #243 | Tragic 5.7% |
Demographics Similar to Palestinians by Male Unemployment
In terms of male unemployment, the demographic groups most similar to Palestinians are Immigrants from Latvia (5.1%, a difference of 0.030%), Nicaraguan (5.1%, a difference of 0.070%), Immigrants from Lithuania (5.1%, a difference of 0.070%), Mongolian (5.1%, a difference of 0.10%), and Ukrainian (5.1%, a difference of 0.11%).
| Demographics | Rating | Rank | Male Unemployment |
| Immigrants | Denmark | 89.4 /100 | #116 | Excellent 5.1% |
| Estonians | 89.0 /100 | #117 | Excellent 5.1% |
| Cypriots | 88.8 /100 | #118 | Excellent 5.1% |
| French Canadians | 88.6 /100 | #119 | Excellent 5.1% |
| Ukrainians | 88.4 /100 | #120 | Excellent 5.1% |
| Mongolians | 88.4 /100 | #121 | Excellent 5.1% |
| Nicaraguans | 88.2 /100 | #122 | Excellent 5.1% |
| Palestinians | 87.7 /100 | #123 | Excellent 5.1% |
| Immigrants | Latvia | 87.5 /100 | #124 | Excellent 5.1% |
| Immigrants | Lithuania | 87.2 /100 | #125 | Excellent 5.1% |
| Immigrants | Colombia | 86.8 /100 | #126 | Excellent 5.1% |
| Immigrants | Brazil | 86.3 /100 | #127 | Excellent 5.2% |
| Hungarians | 85.1 /100 | #128 | Excellent 5.2% |
| Immigrants | Western Europe | 84.8 /100 | #129 | Excellent 5.2% |
| Immigrants | Malaysia | 83.5 /100 | #130 | Excellent 5.2% |