Laotian vs Chippewa Unemployment Among Women with Children Under 6 years
COMPARE
Laotian
Chippewa
Unemployment Among Women with Children Under 6 years
Unemployment Among Women with Children Under 6 years Comparison
Laotians
Chippewa
6.5%
UNEMPLOYMENT AMONG WOMEN WITH CHILDREN UNDER 6 YEARS
100.0/ 100
METRIC RATING
24th/ 347
METRIC RANK
13.3%
UNEMPLOYMENT AMONG WOMEN WITH CHILDREN UNDER 6 YEARS
0.0/ 100
METRIC RATING
337th/ 347
METRIC RANK
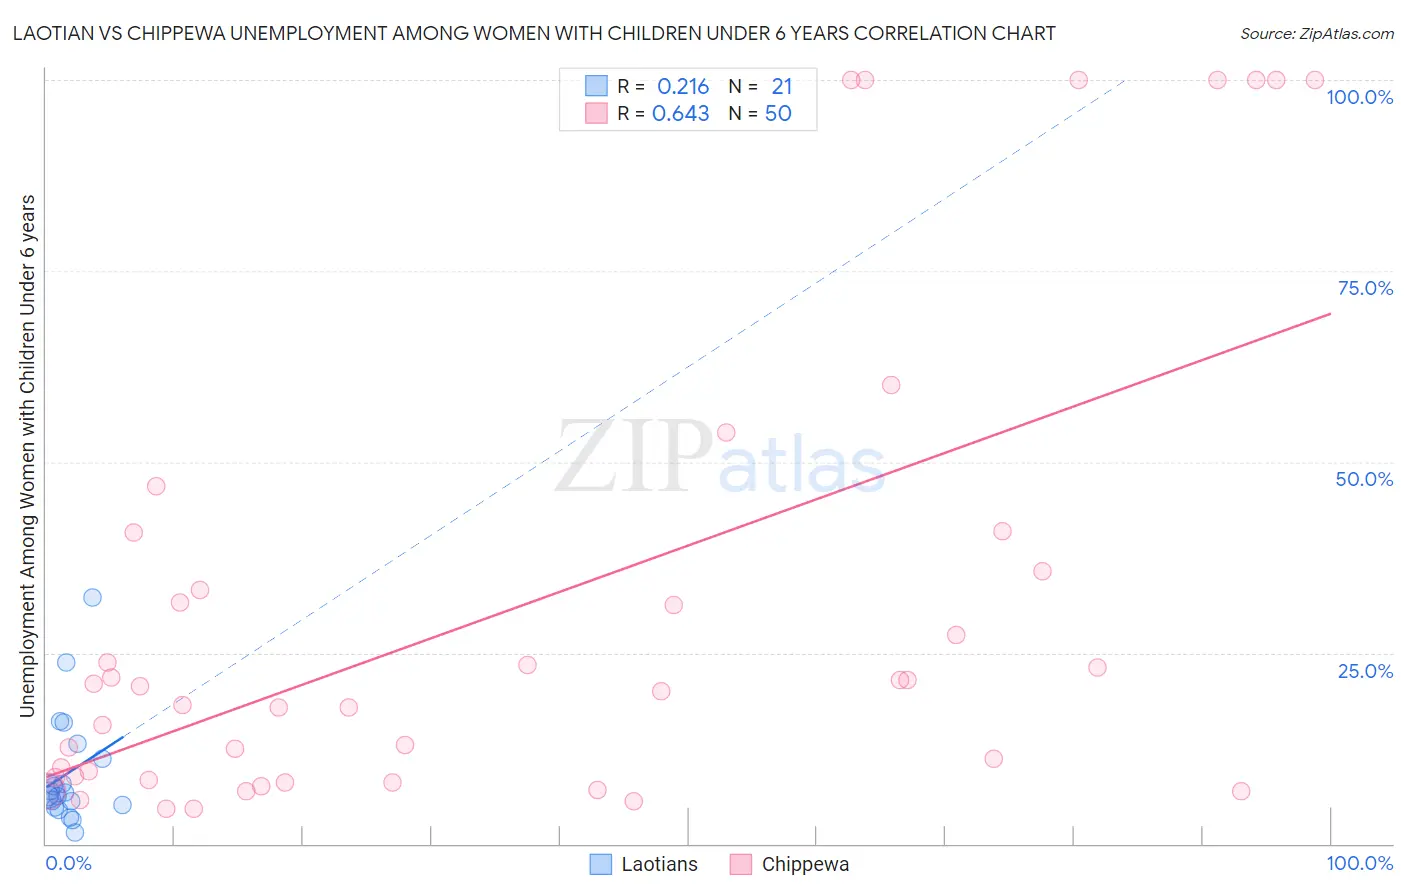
Laotian vs Chippewa Unemployment Among Women with Children Under 6 years Correlation Chart
The statistical analysis conducted on geographies consisting of 191,341,414 people shows a weak positive correlation between the proportion of Laotians and unemployment rate among women with children under the age of 6 in the United States with a correlation coefficient (R) of 0.216 and weighted average of 6.5%. Similarly, the statistical analysis conducted on geographies consisting of 172,974,941 people shows a significant positive correlation between the proportion of Chippewa and unemployment rate among women with children under the age of 6 in the United States with a correlation coefficient (R) of 0.643 and weighted average of 13.3%, a difference of 104.2%.
Unemployment Among Women with Children Under 6 years Correlation Summary
| Measurement | Laotian | Chippewa |
| Minimum | 1.5% | 4.6% |
| Maximum | 32.2% | 100.0% |
| Range | 30.7% | 95.4% |
| Mean | 9.2% | 30.7% |
| Median | 6.7% | 20.3% |
| Interquartile 25% (IQ1) | 4.8% | 8.7% |
| Interquartile 75% (IQ3) | 12.2% | 35.7% |
| Interquartile Range (IQR) | 7.3% | 26.9% |
| Standard Deviation (Sample) | 7.4% | 31.0% |
| Standard Deviation (Population) | 7.3% | 30.7% |
Similar Demographics by Unemployment Among Women with Children Under 6 years
Demographics Similar to Laotians by Unemployment Among Women with Children Under 6 years
In terms of unemployment among women with children under 6 years, the demographic groups most similar to Laotians are Soviet Union (6.5%, a difference of 0.020%), Cypriot (6.5%, a difference of 0.10%), Bulgarian (6.5%, a difference of 0.15%), Immigrants from Japan (6.5%, a difference of 0.20%), and Immigrants from Israel (6.5%, a difference of 0.22%).
| Demographics | Rating | Rank | Unemployment Among Women with Children Under 6 years |
| Immigrants | Malaysia | 100.0 /100 | #17 | Exceptional 6.4% |
| Assyrians/Chaldeans/Syriacs | 100.0 /100 | #18 | Exceptional 6.5% |
| Mongolians | 100.0 /100 | #19 | Exceptional 6.5% |
| Ute | 100.0 /100 | #20 | Exceptional 6.5% |
| Burmese | 100.0 /100 | #21 | Exceptional 6.5% |
| Immigrants | Korea | 100.0 /100 | #22 | Exceptional 6.5% |
| Bulgarians | 100.0 /100 | #23 | Exceptional 6.5% |
| Laotians | 100.0 /100 | #24 | Exceptional 6.5% |
| Soviet Union | 100.0 /100 | #25 | Exceptional 6.5% |
| Cypriots | 100.0 /100 | #26 | Exceptional 6.5% |
| Immigrants | Japan | 100.0 /100 | #27 | Exceptional 6.5% |
| Immigrants | Israel | 100.0 /100 | #28 | Exceptional 6.5% |
| Immigrants | Sweden | 100.0 /100 | #29 | Exceptional 6.6% |
| Immigrants | Belarus | 100.0 /100 | #30 | Exceptional 6.6% |
| Immigrants | Moldova | 100.0 /100 | #31 | Exceptional 6.6% |
Demographics Similar to Chippewa by Unemployment Among Women with Children Under 6 years
In terms of unemployment among women with children under 6 years, the demographic groups most similar to Chippewa are Pima (13.4%, a difference of 0.79%), Shoshone (13.2%, a difference of 1.1%), Navajo (13.5%, a difference of 1.2%), Immigrants from Yemen (13.5%, a difference of 1.2%), and Lumbee (13.8%, a difference of 3.4%).
| Demographics | Rating | Rank | Unemployment Among Women with Children Under 6 years |
| Pennsylvania Germans | 0.0 /100 | #330 | Tragic 10.8% |
| Colville | 0.0 /100 | #331 | Tragic 11.2% |
| Sioux | 0.0 /100 | #332 | Tragic 11.5% |
| Natives/Alaskans | 0.0 /100 | #333 | Tragic 11.5% |
| Apache | 0.0 /100 | #334 | Tragic 12.3% |
| Puerto Ricans | 0.0 /100 | #335 | Tragic 12.5% |
| Shoshone | 0.0 /100 | #336 | Tragic 13.2% |
| Chippewa | 0.0 /100 | #337 | Tragic 13.3% |
| Pima | 0.0 /100 | #338 | Tragic 13.4% |
| Navajo | 0.0 /100 | #339 | Tragic 13.5% |
| Immigrants | Yemen | 0.0 /100 | #340 | Tragic 13.5% |
| Lumbee | 0.0 /100 | #341 | Tragic 13.8% |
| Yuman | 0.0 /100 | #342 | Tragic 14.6% |
| Crow | 0.0 /100 | #343 | Tragic 14.6% |
| Hopi | 0.0 /100 | #344 | Tragic 16.8% |