Guatemalan vs Immigrants from Cambodia Unemployment Among Women with Children Ages 6 to 17 years
COMPARE
Guatemalan
Immigrants from Cambodia
Unemployment Among Women with Children Ages 6 to 17 years
Unemployment Among Women with Children Ages 6 to 17 years Comparison
Guatemalans
Immigrants from Cambodia
9.3%
UNEMPLOYMENT AMONG WOMEN WITH CHILDREN AGES 6 TO 17 YEARS
2.3/ 100
METRIC RATING
240th/ 347
METRIC RANK
7.9%
UNEMPLOYMENT AMONG WOMEN WITH CHILDREN AGES 6 TO 17 YEARS
100.0/ 100
METRIC RATING
32nd/ 347
METRIC RANK
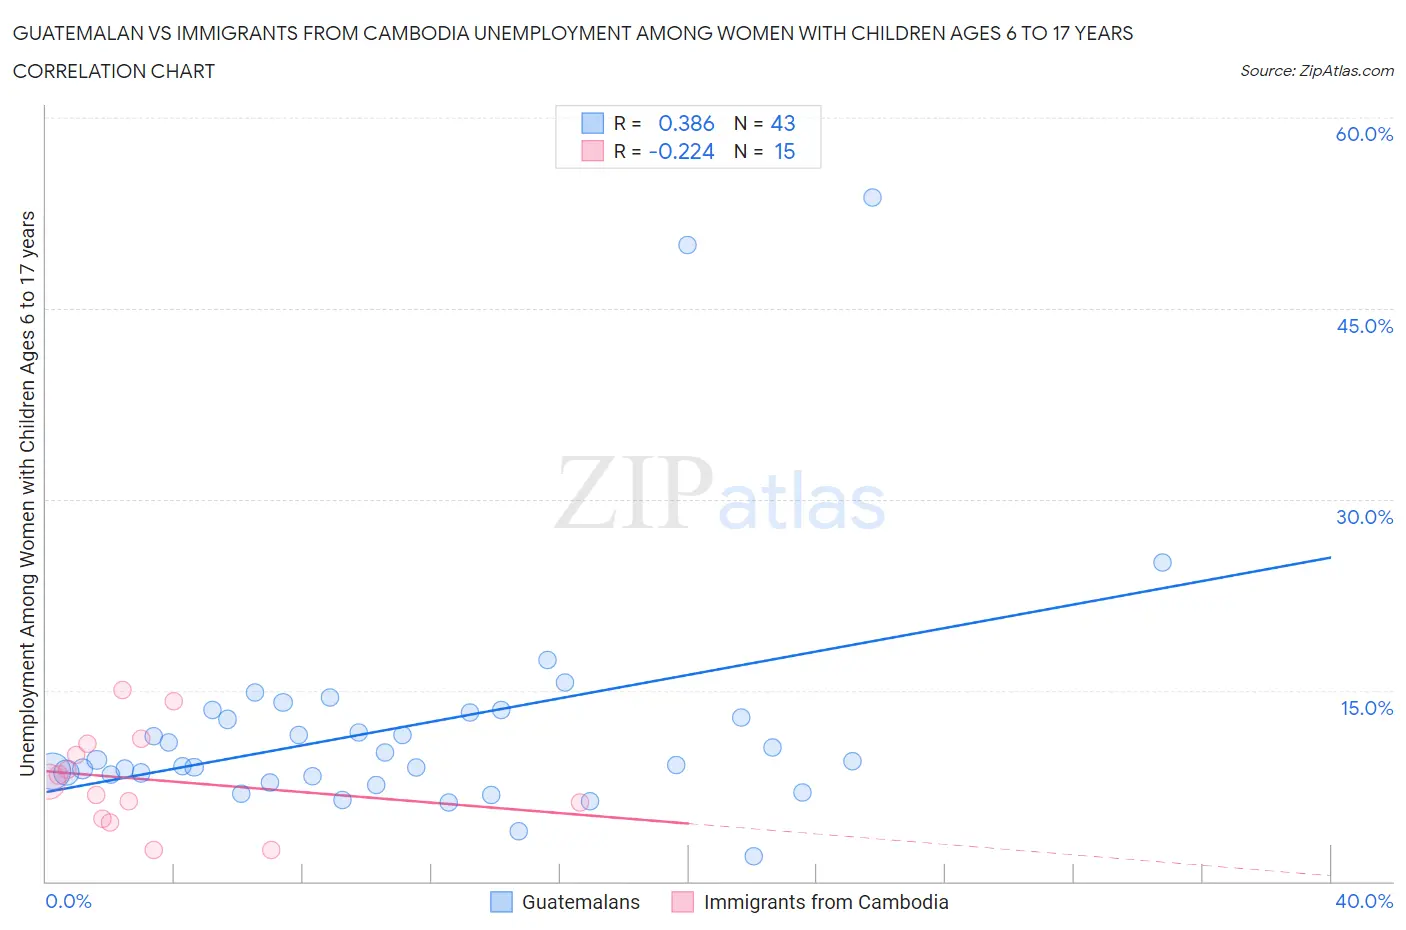
Guatemalan vs Immigrants from Cambodia Unemployment Among Women with Children Ages 6 to 17 years Correlation Chart
The statistical analysis conducted on geographies consisting of 297,853,121 people shows a mild positive correlation between the proportion of Guatemalans and unemployment rate among women with children between the ages 6 and 17 in the United States with a correlation coefficient (R) of 0.386 and weighted average of 9.3%. Similarly, the statistical analysis conducted on geographies consisting of 168,931,928 people shows a weak negative correlation between the proportion of Immigrants from Cambodia and unemployment rate among women with children between the ages 6 and 17 in the United States with a correlation coefficient (R) of -0.224 and weighted average of 7.9%, a difference of 18.0%.
Unemployment Among Women with Children Ages 6 to 17 years Correlation Summary
| Measurement | Guatemalan | Immigrants from Cambodia |
| Minimum | 2.0% | 2.5% |
| Maximum | 53.7% | 15.0% |
| Range | 51.7% | 12.5% |
| Mean | 12.2% | 8.0% |
| Median | 9.4% | 7.8% |
| Interquartile 25% (IQ1) | 8.2% | 4.9% |
| Interquartile 75% (IQ3) | 13.3% | 10.8% |
| Interquartile Range (IQR) | 5.1% | 5.9% |
| Standard Deviation (Sample) | 9.7% | 3.8% |
| Standard Deviation (Population) | 9.6% | 3.6% |
Similar Demographics by Unemployment Among Women with Children Ages 6 to 17 years
Demographics Similar to Guatemalans by Unemployment Among Women with Children Ages 6 to 17 years
In terms of unemployment among women with children ages 6 to 17 years, the demographic groups most similar to Guatemalans are Colombian (9.3%, a difference of 0.070%), Immigrants from Colombia (9.3%, a difference of 0.090%), Arab (9.3%, a difference of 0.14%), Immigrants from Saudi Arabia (9.3%, a difference of 0.14%), and Scottish (9.4%, a difference of 0.18%).
| Demographics | Rating | Rank | Unemployment Among Women with Children Ages 6 to 17 years |
| Immigrants | St. Vincent and the Grenadines | 3.3 /100 | #233 | Tragic 9.3% |
| Mexicans | 3.2 /100 | #234 | Tragic 9.3% |
| Uruguayans | 3.0 /100 | #235 | Tragic 9.3% |
| Hungarians | 3.0 /100 | #236 | Tragic 9.3% |
| Immigrants | Belize | 2.8 /100 | #237 | Tragic 9.3% |
| Arabs | 2.7 /100 | #238 | Tragic 9.3% |
| Immigrants | Saudi Arabia | 2.7 /100 | #239 | Tragic 9.3% |
| Guatemalans | 2.3 /100 | #240 | Tragic 9.3% |
| Colombians | 2.2 /100 | #241 | Tragic 9.3% |
| Immigrants | Colombia | 2.1 /100 | #242 | Tragic 9.3% |
| Scottish | 2.0 /100 | #243 | Tragic 9.4% |
| English | 1.9 /100 | #244 | Tragic 9.4% |
| Immigrants | Cameroon | 1.8 /100 | #245 | Tragic 9.4% |
| Immigrants | Africa | 1.6 /100 | #246 | Tragic 9.4% |
| Poles | 1.5 /100 | #247 | Tragic 9.4% |
Demographics Similar to Immigrants from Cambodia by Unemployment Among Women with Children Ages 6 to 17 years
In terms of unemployment among women with children ages 6 to 17 years, the demographic groups most similar to Immigrants from Cambodia are Laotian (7.9%, a difference of 0.050%), Immigrants from Korea (7.9%, a difference of 0.050%), Immigrants from Iran (7.9%, a difference of 0.24%), Native Hawaiian (7.9%, a difference of 0.34%), and Immigrants from South Central Asia (7.9%, a difference of 0.44%).
| Demographics | Rating | Rank | Unemployment Among Women with Children Ages 6 to 17 years |
| Immigrants | Eastern Asia | 100.0 /100 | #25 | Exceptional 7.7% |
| Indians (Asian) | 100.0 /100 | #26 | Exceptional 7.7% |
| Immigrants | Afghanistan | 100.0 /100 | #27 | Exceptional 7.8% |
| Immigrants | Uzbekistan | 100.0 /100 | #28 | Exceptional 7.8% |
| Thais | 100.0 /100 | #29 | Exceptional 7.8% |
| Immigrants | Iran | 100.0 /100 | #30 | Exceptional 7.9% |
| Laotians | 100.0 /100 | #31 | Exceptional 7.9% |
| Immigrants | Cambodia | 100.0 /100 | #32 | Exceptional 7.9% |
| Immigrants | Korea | 100.0 /100 | #33 | Exceptional 7.9% |
| Native Hawaiians | 100.0 /100 | #34 | Exceptional 7.9% |
| Immigrants | South Central Asia | 100.0 /100 | #35 | Exceptional 7.9% |
| Burmese | 100.0 /100 | #36 | Exceptional 8.0% |
| Asians | 100.0 /100 | #37 | Exceptional 8.0% |
| Alsatians | 100.0 /100 | #38 | Exceptional 8.0% |
| Somalis | 100.0 /100 | #39 | Exceptional 8.0% |