Guamanian/Chamorro vs Assyrian/Chaldean/Syriac Unemployment Among Ages 25 to 29 years
COMPARE
Guamanian/Chamorro
Assyrian/Chaldean/Syriac
Unemployment Among Ages 25 to 29 years
Unemployment Among Ages 25 to 29 years Comparison
Guamanians/Chamorros
Assyrians/Chaldeans/Syriacs
6.8%
UNEMPLOYMENT AMONG AGES 25 TO 29 YEARS
24.3/ 100
METRIC RATING
199th/ 347
METRIC RANK
7.3%
UNEMPLOYMENT AMONG AGES 25 TO 29 YEARS
0.2/ 100
METRIC RATING
257th/ 347
METRIC RANK
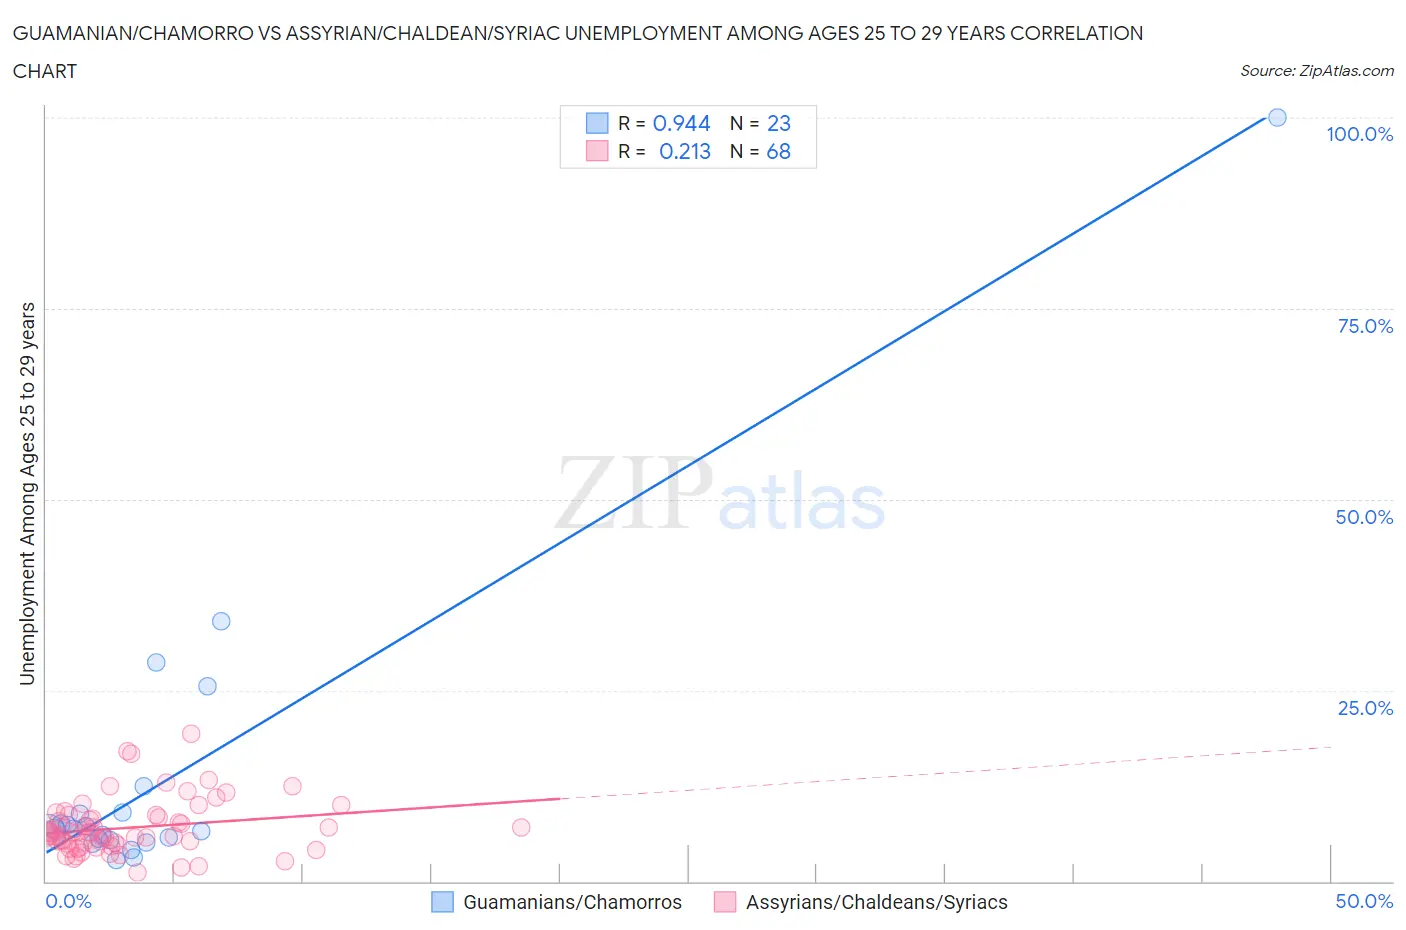
Guamanian/Chamorro vs Assyrian/Chaldean/Syriac Unemployment Among Ages 25 to 29 years Correlation Chart
The statistical analysis conducted on geographies consisting of 216,987,101 people shows a near-perfect positive correlation between the proportion of Guamanians/Chamorros and unemployment rate among population between the ages 25 and 29 in the United States with a correlation coefficient (R) of 0.944 and weighted average of 6.8%. Similarly, the statistical analysis conducted on geographies consisting of 108,796,100 people shows a weak positive correlation between the proportion of Assyrians/Chaldeans/Syriacs and unemployment rate among population between the ages 25 and 29 in the United States with a correlation coefficient (R) of 0.213 and weighted average of 7.3%, a difference of 7.7%.
Unemployment Among Ages 25 to 29 years Correlation Summary
| Measurement | Guamanian/Chamorro | Assyrian/Chaldean/Syriac |
| Minimum | 2.8% | 1.2% |
| Maximum | 100.0% | 19.3% |
| Range | 97.2% | 18.1% |
| Mean | 13.5% | 7.0% |
| Median | 6.8% | 6.3% |
| Interquartile 25% (IQ1) | 5.4% | 4.8% |
| Interquartile 75% (IQ3) | 9.0% | 8.6% |
| Interquartile Range (IQR) | 3.5% | 3.7% |
| Standard Deviation (Sample) | 20.6% | 3.6% |
| Standard Deviation (Population) | 20.1% | 3.6% |
Similar Demographics by Unemployment Among Ages 25 to 29 years
Demographics Similar to Guamanians/Chamorros by Unemployment Among Ages 25 to 29 years
In terms of unemployment among ages 25 to 29 years, the demographic groups most similar to Guamanians/Chamorros are Immigrants from Southern Europe (6.8%, a difference of 0.020%), South American Indian (6.8%, a difference of 0.080%), Basque (6.8%, a difference of 0.15%), Italian (6.8%, a difference of 0.18%), and Hungarian (6.8%, a difference of 0.20%).
| Demographics | Rating | Rank | Unemployment Among Ages 25 to 29 years |
| Immigrants | Ukraine | 28.6 /100 | #192 | Fair 6.7% |
| Alsatians | 28.1 /100 | #193 | Fair 6.7% |
| Immigrants | Greece | 28.0 /100 | #194 | Fair 6.7% |
| Immigrants | Western Asia | 27.3 /100 | #195 | Fair 6.7% |
| Hungarians | 26.8 /100 | #196 | Fair 6.8% |
| Italians | 26.5 /100 | #197 | Fair 6.8% |
| Immigrants | Southern Europe | 24.6 /100 | #198 | Fair 6.8% |
| Guamanians/Chamorros | 24.3 /100 | #199 | Fair 6.8% |
| South American Indians | 23.3 /100 | #200 | Fair 6.8% |
| Basques | 22.5 /100 | #201 | Fair 6.8% |
| Immigrants | Argentina | 21.6 /100 | #202 | Fair 6.8% |
| Immigrants | Norway | 21.2 /100 | #203 | Fair 6.8% |
| Scotch-Irish | 20.0 /100 | #204 | Poor 6.8% |
| Immigrants | England | 19.8 /100 | #205 | Poor 6.8% |
| Ugandans | 19.8 /100 | #206 | Poor 6.8% |
Demographics Similar to Assyrians/Chaldeans/Syriacs by Unemployment Among Ages 25 to 29 years
In terms of unemployment among ages 25 to 29 years, the demographic groups most similar to Assyrians/Chaldeans/Syriacs are Mexican American Indian (7.3%, a difference of 0.37%), Ottawa (7.3%, a difference of 0.40%), Immigrants from Cameroon (7.2%, a difference of 0.57%), Cree (7.3%, a difference of 0.61%), and Ghanaian (7.2%, a difference of 0.63%).
| Demographics | Rating | Rank | Unemployment Among Ages 25 to 29 years |
| Delaware | 0.5 /100 | #250 | Tragic 7.2% |
| Portuguese | 0.5 /100 | #251 | Tragic 7.2% |
| Sierra Leoneans | 0.4 /100 | #252 | Tragic 7.2% |
| Immigrants | Portugal | 0.3 /100 | #253 | Tragic 7.2% |
| Ghanaians | 0.3 /100 | #254 | Tragic 7.2% |
| Immigrants | Cameroon | 0.3 /100 | #255 | Tragic 7.2% |
| Mexican American Indians | 0.3 /100 | #256 | Tragic 7.3% |
| Assyrians/Chaldeans/Syriacs | 0.2 /100 | #257 | Tragic 7.3% |
| Ottawa | 0.1 /100 | #258 | Tragic 7.3% |
| Cree | 0.1 /100 | #259 | Tragic 7.3% |
| Americans | 0.1 /100 | #260 | Tragic 7.4% |
| Nigerians | 0.1 /100 | #261 | Tragic 7.4% |
| Ecuadorians | 0.1 /100 | #262 | Tragic 7.4% |
| Kiowa | 0.1 /100 | #263 | Tragic 7.4% |
| Immigrants | Western Africa | 0.1 /100 | #264 | Tragic 7.4% |