Bahamian vs Assyrian/Chaldean/Syriac Unemployment Among Ages 25 to 29 years
COMPARE
Bahamian
Assyrian/Chaldean/Syriac
Unemployment Among Ages 25 to 29 years
Unemployment Among Ages 25 to 29 years Comparison
Bahamians
Assyrians/Chaldeans/Syriacs
7.5%
UNEMPLOYMENT AMONG AGES 25 TO 29 YEARS
0.0/ 100
METRIC RATING
270th/ 347
METRIC RANK
7.3%
UNEMPLOYMENT AMONG AGES 25 TO 29 YEARS
0.2/ 100
METRIC RATING
257th/ 347
METRIC RANK
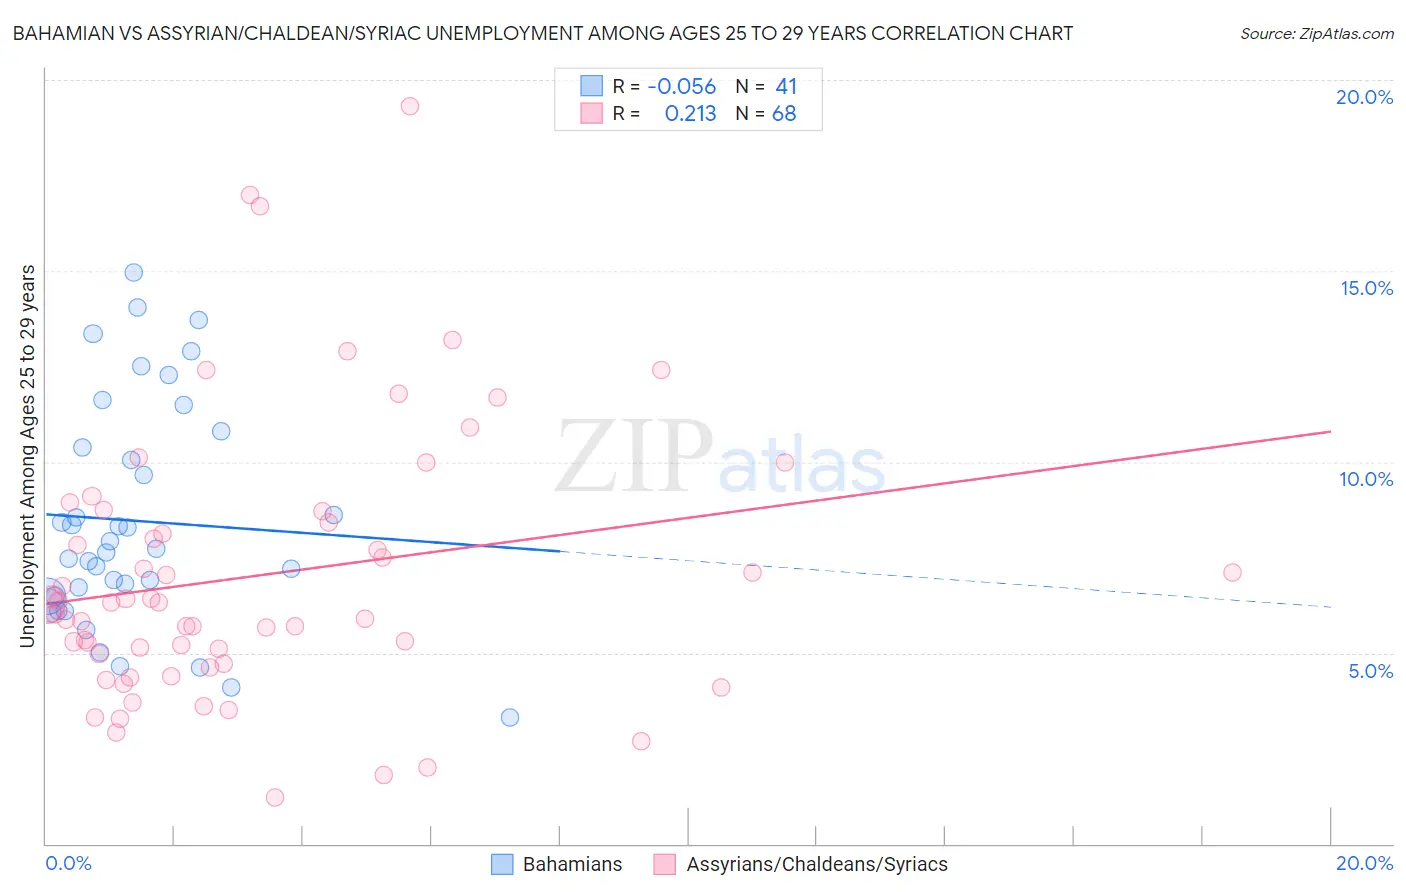
Bahamian vs Assyrian/Chaldean/Syriac Unemployment Among Ages 25 to 29 years Correlation Chart
The statistical analysis conducted on geographies consisting of 110,749,635 people shows a slight negative correlation between the proportion of Bahamians and unemployment rate among population between the ages 25 and 29 in the United States with a correlation coefficient (R) of -0.056 and weighted average of 7.5%. Similarly, the statistical analysis conducted on geographies consisting of 108,796,100 people shows a weak positive correlation between the proportion of Assyrians/Chaldeans/Syriacs and unemployment rate among population between the ages 25 and 29 in the United States with a correlation coefficient (R) of 0.213 and weighted average of 7.3%, a difference of 2.3%.
Unemployment Among Ages 25 to 29 years Correlation Summary
| Measurement | Bahamian | Assyrian/Chaldean/Syriac |
| Minimum | 3.3% | 1.2% |
| Maximum | 15.0% | 19.3% |
| Range | 11.7% | 18.1% |
| Mean | 8.5% | 7.0% |
| Median | 7.7% | 6.3% |
| Interquartile 25% (IQ1) | 6.5% | 4.8% |
| Interquartile 75% (IQ3) | 10.6% | 8.6% |
| Interquartile Range (IQR) | 4.1% | 3.7% |
| Standard Deviation (Sample) | 2.9% | 3.6% |
| Standard Deviation (Population) | 2.9% | 3.6% |
Demographics Similar to Bahamians and Assyrians/Chaldeans/Syriacs by Unemployment Among Ages 25 to 29 years
In terms of unemployment among ages 25 to 29 years, the demographic groups most similar to Bahamians are Choctaw (7.5%, a difference of 0.020%), Immigrants from Bahamas (7.5%, a difference of 0.080%), Immigrants from Nigeria (7.5%, a difference of 0.10%), Immigrants from Latin America (7.4%, a difference of 0.51%), and Immigrants from Ecuador (7.4%, a difference of 0.57%). Similarly, the demographic groups most similar to Assyrians/Chaldeans/Syriacs are Mexican American Indian (7.3%, a difference of 0.37%), Ottawa (7.3%, a difference of 0.40%), Immigrants from Cameroon (7.2%, a difference of 0.57%), Cree (7.3%, a difference of 0.61%), and Ghanaian (7.2%, a difference of 0.63%).
| Demographics | Rating | Rank | Unemployment Among Ages 25 to 29 years |
| Immigrants | Portugal | 0.3 /100 | #253 | Tragic 7.2% |
| Ghanaians | 0.3 /100 | #254 | Tragic 7.2% |
| Immigrants | Cameroon | 0.3 /100 | #255 | Tragic 7.2% |
| Mexican American Indians | 0.3 /100 | #256 | Tragic 7.3% |
| Assyrians/Chaldeans/Syriacs | 0.2 /100 | #257 | Tragic 7.3% |
| Ottawa | 0.1 /100 | #258 | Tragic 7.3% |
| Cree | 0.1 /100 | #259 | Tragic 7.3% |
| Americans | 0.1 /100 | #260 | Tragic 7.4% |
| Nigerians | 0.1 /100 | #261 | Tragic 7.4% |
| Ecuadorians | 0.1 /100 | #262 | Tragic 7.4% |
| Kiowa | 0.1 /100 | #263 | Tragic 7.4% |
| Immigrants | Western Africa | 0.1 /100 | #264 | Tragic 7.4% |
| Immigrants | Fiji | 0.1 /100 | #265 | Tragic 7.4% |
| Paiute | 0.1 /100 | #266 | Tragic 7.4% |
| Pennsylvania Germans | 0.1 /100 | #267 | Tragic 7.4% |
| Immigrants | Ecuador | 0.1 /100 | #268 | Tragic 7.4% |
| Immigrants | Latin America | 0.1 /100 | #269 | Tragic 7.4% |
| Bahamians | 0.0 /100 | #270 | Tragic 7.5% |
| Choctaw | 0.0 /100 | #271 | Tragic 7.5% |
| Immigrants | Bahamas | 0.0 /100 | #272 | Tragic 7.5% |
| Immigrants | Nigeria | 0.0 /100 | #273 | Tragic 7.5% |