South African vs Assyrian/Chaldean/Syriac Unemployment Among Ages 25 to 29 years
COMPARE
South African
Assyrian/Chaldean/Syriac
Unemployment Among Ages 25 to 29 years
Unemployment Among Ages 25 to 29 years Comparison
South Africans
Assyrians/Chaldeans/Syriacs
6.6%
UNEMPLOYMENT AMONG AGES 25 TO 29 YEARS
63.5/ 100
METRIC RATING
157th/ 347
METRIC RANK
7.3%
UNEMPLOYMENT AMONG AGES 25 TO 29 YEARS
0.2/ 100
METRIC RATING
257th/ 347
METRIC RANK
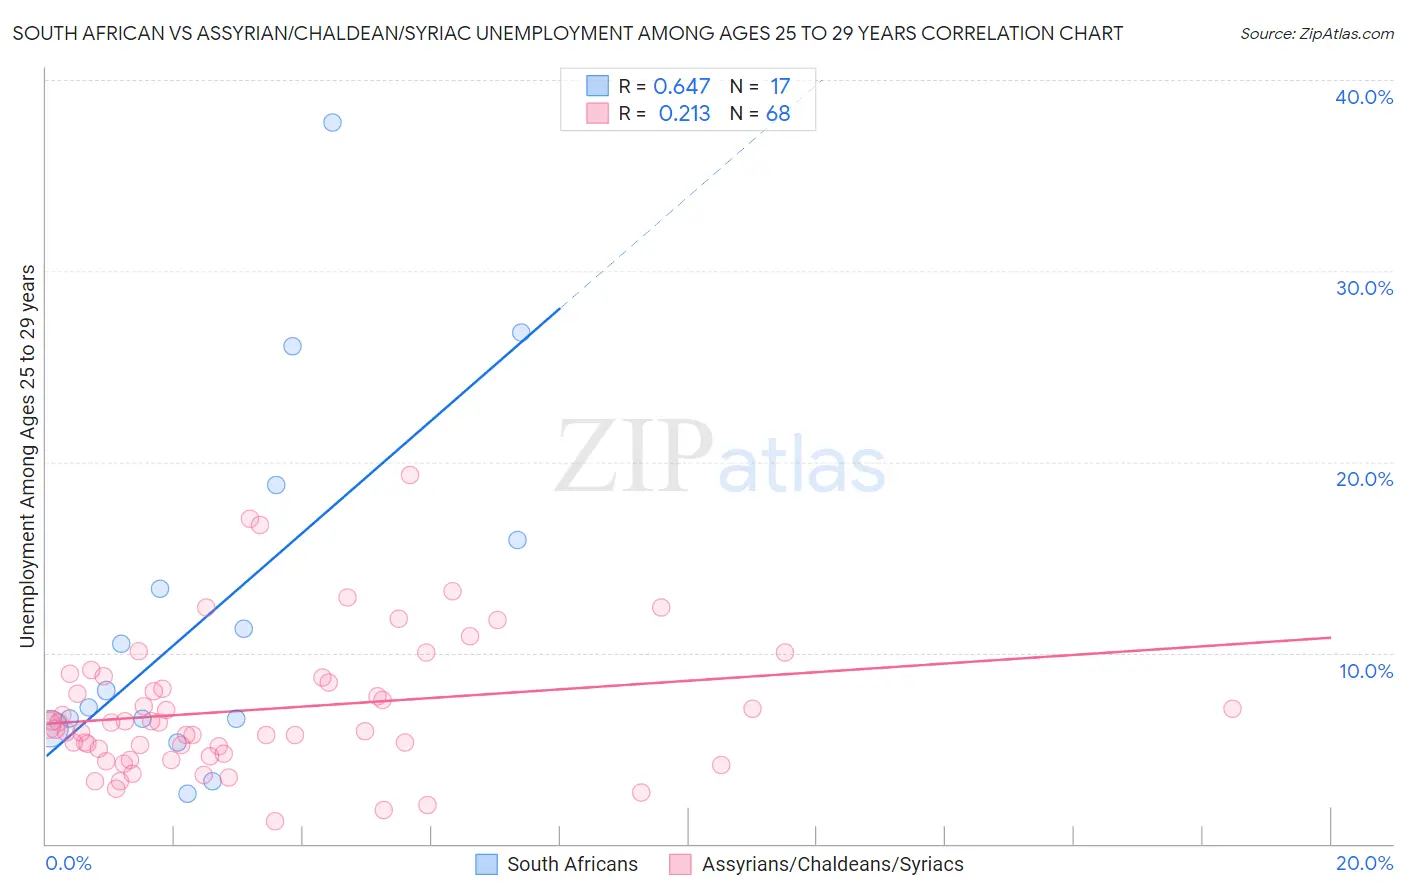
South African vs Assyrian/Chaldean/Syriac Unemployment Among Ages 25 to 29 years Correlation Chart
The statistical analysis conducted on geographies consisting of 177,405,942 people shows a significant positive correlation between the proportion of South Africans and unemployment rate among population between the ages 25 and 29 in the United States with a correlation coefficient (R) of 0.647 and weighted average of 6.6%. Similarly, the statistical analysis conducted on geographies consisting of 108,796,100 people shows a weak positive correlation between the proportion of Assyrians/Chaldeans/Syriacs and unemployment rate among population between the ages 25 and 29 in the United States with a correlation coefficient (R) of 0.213 and weighted average of 7.3%, a difference of 10.6%.
Unemployment Among Ages 25 to 29 years Correlation Summary
| Measurement | South African | Assyrian/Chaldean/Syriac |
| Minimum | 2.6% | 1.2% |
| Maximum | 37.8% | 19.3% |
| Range | 35.2% | 18.1% |
| Mean | 12.5% | 7.0% |
| Median | 8.0% | 6.3% |
| Interquartile 25% (IQ1) | 6.3% | 4.8% |
| Interquartile 75% (IQ3) | 17.4% | 8.6% |
| Interquartile Range (IQR) | 11.1% | 3.7% |
| Standard Deviation (Sample) | 9.7% | 3.6% |
| Standard Deviation (Population) | 9.4% | 3.6% |
Similar Demographics by Unemployment Among Ages 25 to 29 years
Demographics Similar to South Africans by Unemployment Among Ages 25 to 29 years
In terms of unemployment among ages 25 to 29 years, the demographic groups most similar to South Africans are Immigrants from Laos (6.6%, a difference of 0.0%), Immigrants from Latvia (6.6%, a difference of 0.020%), Colombian (6.6%, a difference of 0.030%), Immigrants from Italy (6.6%, a difference of 0.060%), and Samoan (6.6%, a difference of 0.080%).
| Demographics | Rating | Rank | Unemployment Among Ages 25 to 29 years |
| Finns | 66.9 /100 | #150 | Good 6.6% |
| Ukrainians | 65.5 /100 | #151 | Good 6.6% |
| Samoans | 64.6 /100 | #152 | Good 6.6% |
| Immigrants | Italy | 64.4 /100 | #153 | Good 6.6% |
| Colombians | 64.0 /100 | #154 | Good 6.6% |
| Immigrants | Latvia | 63.9 /100 | #155 | Good 6.6% |
| Immigrants | Laos | 63.5 /100 | #156 | Good 6.6% |
| South Africans | 63.5 /100 | #157 | Good 6.6% |
| Immigrants | Russia | 61.5 /100 | #158 | Good 6.6% |
| Welsh | 61.3 /100 | #159 | Good 6.6% |
| Scottish | 60.7 /100 | #160 | Good 6.6% |
| Paraguayans | 60.4 /100 | #161 | Good 6.6% |
| Immigrants | Czechoslovakia | 60.2 /100 | #162 | Good 6.6% |
| Immigrants | Middle Africa | 59.4 /100 | #163 | Average 6.6% |
| Greeks | 58.5 /100 | #164 | Average 6.6% |
Demographics Similar to Assyrians/Chaldeans/Syriacs by Unemployment Among Ages 25 to 29 years
In terms of unemployment among ages 25 to 29 years, the demographic groups most similar to Assyrians/Chaldeans/Syriacs are Mexican American Indian (7.3%, a difference of 0.37%), Ottawa (7.3%, a difference of 0.40%), Immigrants from Cameroon (7.2%, a difference of 0.57%), Cree (7.3%, a difference of 0.61%), and Ghanaian (7.2%, a difference of 0.63%).
| Demographics | Rating | Rank | Unemployment Among Ages 25 to 29 years |
| Delaware | 0.5 /100 | #250 | Tragic 7.2% |
| Portuguese | 0.5 /100 | #251 | Tragic 7.2% |
| Sierra Leoneans | 0.4 /100 | #252 | Tragic 7.2% |
| Immigrants | Portugal | 0.3 /100 | #253 | Tragic 7.2% |
| Ghanaians | 0.3 /100 | #254 | Tragic 7.2% |
| Immigrants | Cameroon | 0.3 /100 | #255 | Tragic 7.2% |
| Mexican American Indians | 0.3 /100 | #256 | Tragic 7.3% |
| Assyrians/Chaldeans/Syriacs | 0.2 /100 | #257 | Tragic 7.3% |
| Ottawa | 0.1 /100 | #258 | Tragic 7.3% |
| Cree | 0.1 /100 | #259 | Tragic 7.3% |
| Americans | 0.1 /100 | #260 | Tragic 7.4% |
| Nigerians | 0.1 /100 | #261 | Tragic 7.4% |
| Ecuadorians | 0.1 /100 | #262 | Tragic 7.4% |
| Kiowa | 0.1 /100 | #263 | Tragic 7.4% |
| Immigrants | Western Africa | 0.1 /100 | #264 | Tragic 7.4% |