Guamanian/Chamorro vs Brazilian Unemployment Among Ages 25 to 29 years
COMPARE
Guamanian/Chamorro
Brazilian
Unemployment Among Ages 25 to 29 years
Unemployment Among Ages 25 to 29 years Comparison
Guamanians/Chamorros
Brazilians
6.8%
UNEMPLOYMENT AMONG AGES 25 TO 29 YEARS
24.3/ 100
METRIC RATING
199th/ 347
METRIC RANK
6.5%
UNEMPLOYMENT AMONG AGES 25 TO 29 YEARS
81.9/ 100
METRIC RATING
126th/ 347
METRIC RANK
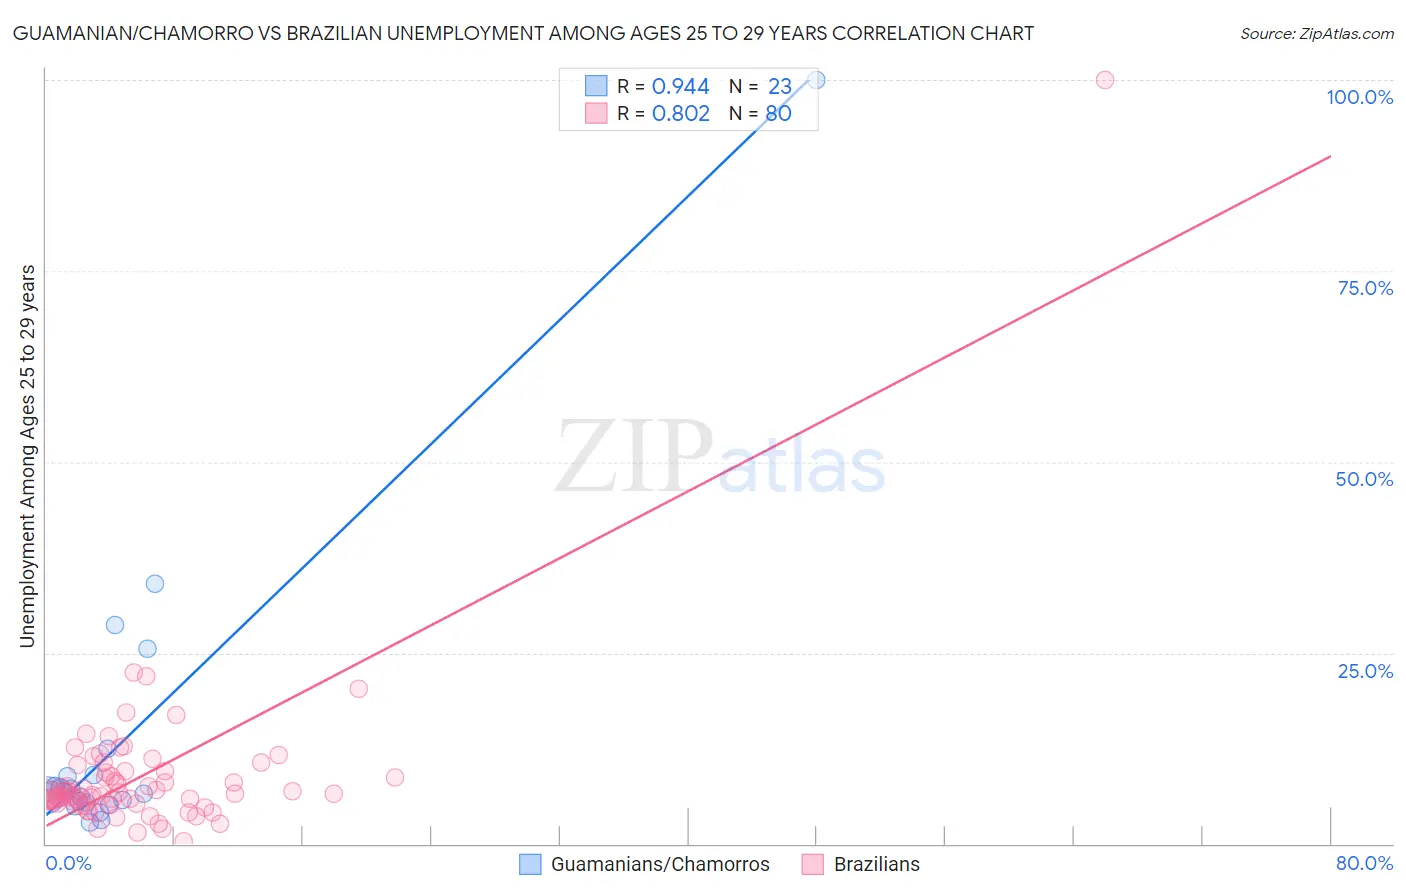
Guamanian/Chamorro vs Brazilian Unemployment Among Ages 25 to 29 years Correlation Chart
The statistical analysis conducted on geographies consisting of 216,987,101 people shows a near-perfect positive correlation between the proportion of Guamanians/Chamorros and unemployment rate among population between the ages 25 and 29 in the United States with a correlation coefficient (R) of 0.944 and weighted average of 6.8%. Similarly, the statistical analysis conducted on geographies consisting of 311,458,460 people shows a very strong positive correlation between the proportion of Brazilians and unemployment rate among population between the ages 25 and 29 in the United States with a correlation coefficient (R) of 0.802 and weighted average of 6.5%, a difference of 4.2%.
Unemployment Among Ages 25 to 29 years Correlation Summary
| Measurement | Guamanian/Chamorro | Brazilian |
| Minimum | 2.8% | 0.40% |
| Maximum | 100.0% | 100.0% |
| Range | 97.2% | 99.6% |
| Mean | 13.5% | 8.8% |
| Median | 6.8% | 6.5% |
| Interquartile 25% (IQ1) | 5.4% | 5.4% |
| Interquartile 75% (IQ3) | 9.0% | 9.5% |
| Interquartile Range (IQR) | 3.5% | 4.0% |
| Standard Deviation (Sample) | 20.6% | 11.2% |
| Standard Deviation (Population) | 20.1% | 11.1% |
Similar Demographics by Unemployment Among Ages 25 to 29 years
Demographics Similar to Guamanians/Chamorros by Unemployment Among Ages 25 to 29 years
In terms of unemployment among ages 25 to 29 years, the demographic groups most similar to Guamanians/Chamorros are Immigrants from Southern Europe (6.8%, a difference of 0.020%), South American Indian (6.8%, a difference of 0.080%), Basque (6.8%, a difference of 0.15%), Italian (6.8%, a difference of 0.18%), and Hungarian (6.8%, a difference of 0.20%).
| Demographics | Rating | Rank | Unemployment Among Ages 25 to 29 years |
| Immigrants | Ukraine | 28.6 /100 | #192 | Fair 6.7% |
| Alsatians | 28.1 /100 | #193 | Fair 6.7% |
| Immigrants | Greece | 28.0 /100 | #194 | Fair 6.7% |
| Immigrants | Western Asia | 27.3 /100 | #195 | Fair 6.7% |
| Hungarians | 26.8 /100 | #196 | Fair 6.8% |
| Italians | 26.5 /100 | #197 | Fair 6.8% |
| Immigrants | Southern Europe | 24.6 /100 | #198 | Fair 6.8% |
| Guamanians/Chamorros | 24.3 /100 | #199 | Fair 6.8% |
| South American Indians | 23.3 /100 | #200 | Fair 6.8% |
| Basques | 22.5 /100 | #201 | Fair 6.8% |
| Immigrants | Argentina | 21.6 /100 | #202 | Fair 6.8% |
| Immigrants | Norway | 21.2 /100 | #203 | Fair 6.8% |
| Scotch-Irish | 20.0 /100 | #204 | Poor 6.8% |
| Immigrants | England | 19.8 /100 | #205 | Poor 6.8% |
| Ugandans | 19.8 /100 | #206 | Poor 6.8% |
Demographics Similar to Brazilians by Unemployment Among Ages 25 to 29 years
In terms of unemployment among ages 25 to 29 years, the demographic groups most similar to Brazilians are Syrian (6.5%, a difference of 0.020%), Arab (6.5%, a difference of 0.060%), Dutch (6.5%, a difference of 0.13%), Immigrants from Chile (6.5%, a difference of 0.15%), and Sri Lankan (6.5%, a difference of 0.17%).
| Demographics | Rating | Rank | Unemployment Among Ages 25 to 29 years |
| Immigrants | South Africa | 84.9 /100 | #119 | Excellent 6.5% |
| Immigrants | Moldova | 84.5 /100 | #120 | Excellent 6.5% |
| Immigrants | Uganda | 84.5 /100 | #121 | Excellent 6.5% |
| Immigrants | Belarus | 83.7 /100 | #122 | Excellent 6.5% |
| Laotians | 83.6 /100 | #123 | Excellent 6.5% |
| Arabs | 82.5 /100 | #124 | Excellent 6.5% |
| Syrians | 82.1 /100 | #125 | Excellent 6.5% |
| Brazilians | 81.9 /100 | #126 | Excellent 6.5% |
| Dutch | 80.6 /100 | #127 | Excellent 6.5% |
| Immigrants | Chile | 80.5 /100 | #128 | Excellent 6.5% |
| Sri Lankans | 80.3 /100 | #129 | Excellent 6.5% |
| Immigrants | Peru | 79.9 /100 | #130 | Good 6.5% |
| Immigrants | Afghanistan | 79.2 /100 | #131 | Good 6.5% |
| Poles | 76.6 /100 | #132 | Good 6.5% |
| Immigrants | Europe | 75.7 /100 | #133 | Good 6.5% |