Immigrants from Central America vs Portuguese Unemployment Among Ages 30 to 34 years
COMPARE
Immigrants from Central America
Portuguese
Unemployment Among Ages 30 to 34 years
Unemployment Among Ages 30 to 34 years Comparison
Immigrants from Central America
Portuguese
6.2%
UNEMPLOYMENT AMONG AGES 30 TO 34 YEARS
0.1/ 100
METRIC RATING
262nd/ 347
METRIC RANK
5.9%
UNEMPLOYMENT AMONG AGES 30 TO 34 YEARS
0.8/ 100
METRIC RATING
234th/ 347
METRIC RANK
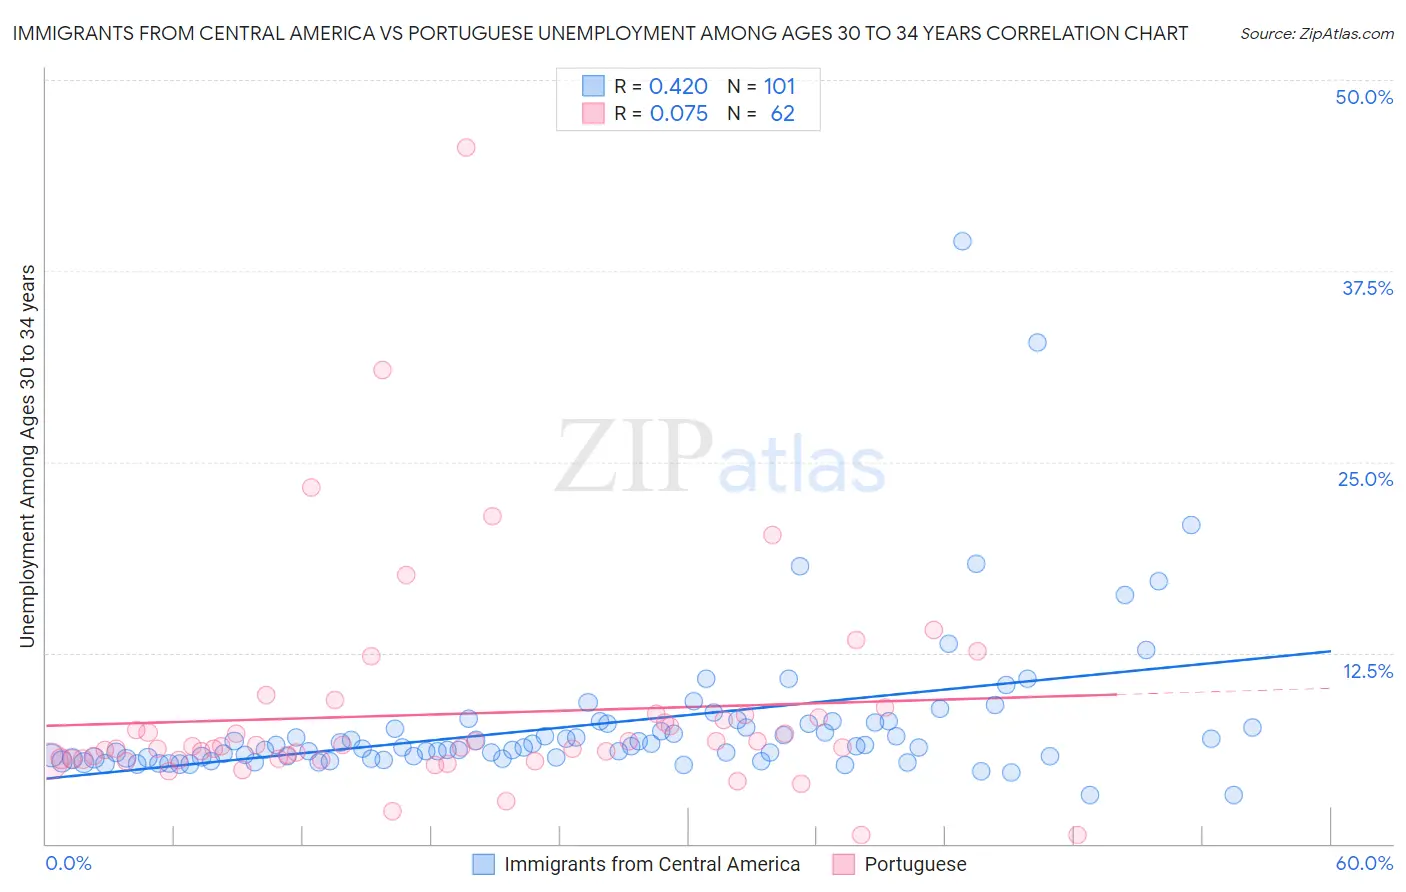
Immigrants from Central America vs Portuguese Unemployment Among Ages 30 to 34 years Correlation Chart
The statistical analysis conducted on geographies consisting of 481,234,417 people shows a moderate positive correlation between the proportion of Immigrants from Central America and unemployment rate among population between the ages 30 and 34 in the United States with a correlation coefficient (R) of 0.420 and weighted average of 6.2%. Similarly, the statistical analysis conducted on geographies consisting of 416,195,199 people shows a slight positive correlation between the proportion of Portuguese and unemployment rate among population between the ages 30 and 34 in the United States with a correlation coefficient (R) of 0.075 and weighted average of 5.9%, a difference of 4.2%.
Unemployment Among Ages 30 to 34 years Correlation Summary
| Measurement | Immigrants from Central America | Portuguese |
| Minimum | 3.2% | 0.60% |
| Maximum | 39.4% | 45.5% |
| Range | 36.2% | 44.9% |
| Mean | 7.8% | 8.5% |
| Median | 6.3% | 6.3% |
| Interquartile 25% (IQ1) | 5.6% | 5.6% |
| Interquartile 75% (IQ3) | 7.9% | 8.3% |
| Interquartile Range (IQR) | 2.3% | 2.7% |
| Standard Deviation (Sample) | 5.1% | 7.1% |
| Standard Deviation (Population) | 5.0% | 7.0% |
Similar Demographics by Unemployment Among Ages 30 to 34 years
Demographics Similar to Immigrants from Central America by Unemployment Among Ages 30 to 34 years
In terms of unemployment among ages 30 to 34 years, the demographic groups most similar to Immigrants from Central America are Immigrants from Western Africa (6.2%, a difference of 0.18%), Immigrants from Latin America (6.1%, a difference of 0.33%), Spanish American (6.2%, a difference of 0.50%), Chickasaw (6.2%, a difference of 0.54%), and Haitian (6.1%, a difference of 0.55%).
| Demographics | Rating | Rank | Unemployment Among Ages 30 to 34 years |
| Immigrants | Portugal | 0.1 /100 | #255 | Tragic 6.1% |
| Immigrants | Ghana | 0.1 /100 | #256 | Tragic 6.1% |
| Immigrants | Sierra Leone | 0.1 /100 | #257 | Tragic 6.1% |
| Mexicans | 0.1 /100 | #258 | Tragic 6.1% |
| Haitians | 0.1 /100 | #259 | Tragic 6.1% |
| Immigrants | Latin America | 0.1 /100 | #260 | Tragic 6.1% |
| Immigrants | Western Africa | 0.1 /100 | #261 | Tragic 6.2% |
| Immigrants | Central America | 0.1 /100 | #262 | Tragic 6.2% |
| Spanish Americans | 0.0 /100 | #263 | Tragic 6.2% |
| Chickasaw | 0.0 /100 | #264 | Tragic 6.2% |
| Americans | 0.0 /100 | #265 | Tragic 6.2% |
| Seminole | 0.0 /100 | #266 | Tragic 6.2% |
| Immigrants | Mexico | 0.0 /100 | #267 | Tragic 6.2% |
| Immigrants | Haiti | 0.0 /100 | #268 | Tragic 6.2% |
| French American Indians | 0.0 /100 | #269 | Tragic 6.3% |
Demographics Similar to Portuguese by Unemployment Among Ages 30 to 34 years
In terms of unemployment among ages 30 to 34 years, the demographic groups most similar to Portuguese are Nepalese (5.9%, a difference of 0.030%), Yaqui (5.9%, a difference of 0.12%), Native Hawaiian (5.9%, a difference of 0.24%), Iroquois (5.9%, a difference of 0.41%), and Central American (5.9%, a difference of 0.41%).
| Demographics | Rating | Rank | Unemployment Among Ages 30 to 34 years |
| Spanish | 1.8 /100 | #227 | Tragic 5.8% |
| Immigrants | Bahamas | 1.8 /100 | #228 | Tragic 5.8% |
| Immigrants | Uzbekistan | 1.5 /100 | #229 | Tragic 5.9% |
| Hawaiians | 1.2 /100 | #230 | Tragic 5.9% |
| Japanese | 1.1 /100 | #231 | Tragic 5.9% |
| Iroquois | 1.0 /100 | #232 | Tragic 5.9% |
| Nepalese | 0.8 /100 | #233 | Tragic 5.9% |
| Portuguese | 0.8 /100 | #234 | Tragic 5.9% |
| Yaqui | 0.7 /100 | #235 | Tragic 5.9% |
| Native Hawaiians | 0.7 /100 | #236 | Tragic 5.9% |
| Central Americans | 0.6 /100 | #237 | Tragic 5.9% |
| Mexican American Indians | 0.6 /100 | #238 | Tragic 5.9% |
| Immigrants | Nigeria | 0.6 /100 | #239 | Tragic 6.0% |
| Salvadorans | 0.5 /100 | #240 | Tragic 6.0% |
| Immigrants | El Salvador | 0.5 /100 | #241 | Tragic 6.0% |