Greek vs Immigrants from Cameroon Unemployment Among Ages 30 to 34 years
COMPARE
Greek
Immigrants from Cameroon
Unemployment Among Ages 30 to 34 years
Unemployment Among Ages 30 to 34 years Comparison
Greeks
Immigrants from Cameroon
5.3%
UNEMPLOYMENT AMONG AGES 30 TO 34 YEARS
80.4/ 100
METRIC RATING
125th/ 347
METRIC RANK
5.6%
UNEMPLOYMENT AMONG AGES 30 TO 34 YEARS
18.4/ 100
METRIC RATING
204th/ 347
METRIC RANK
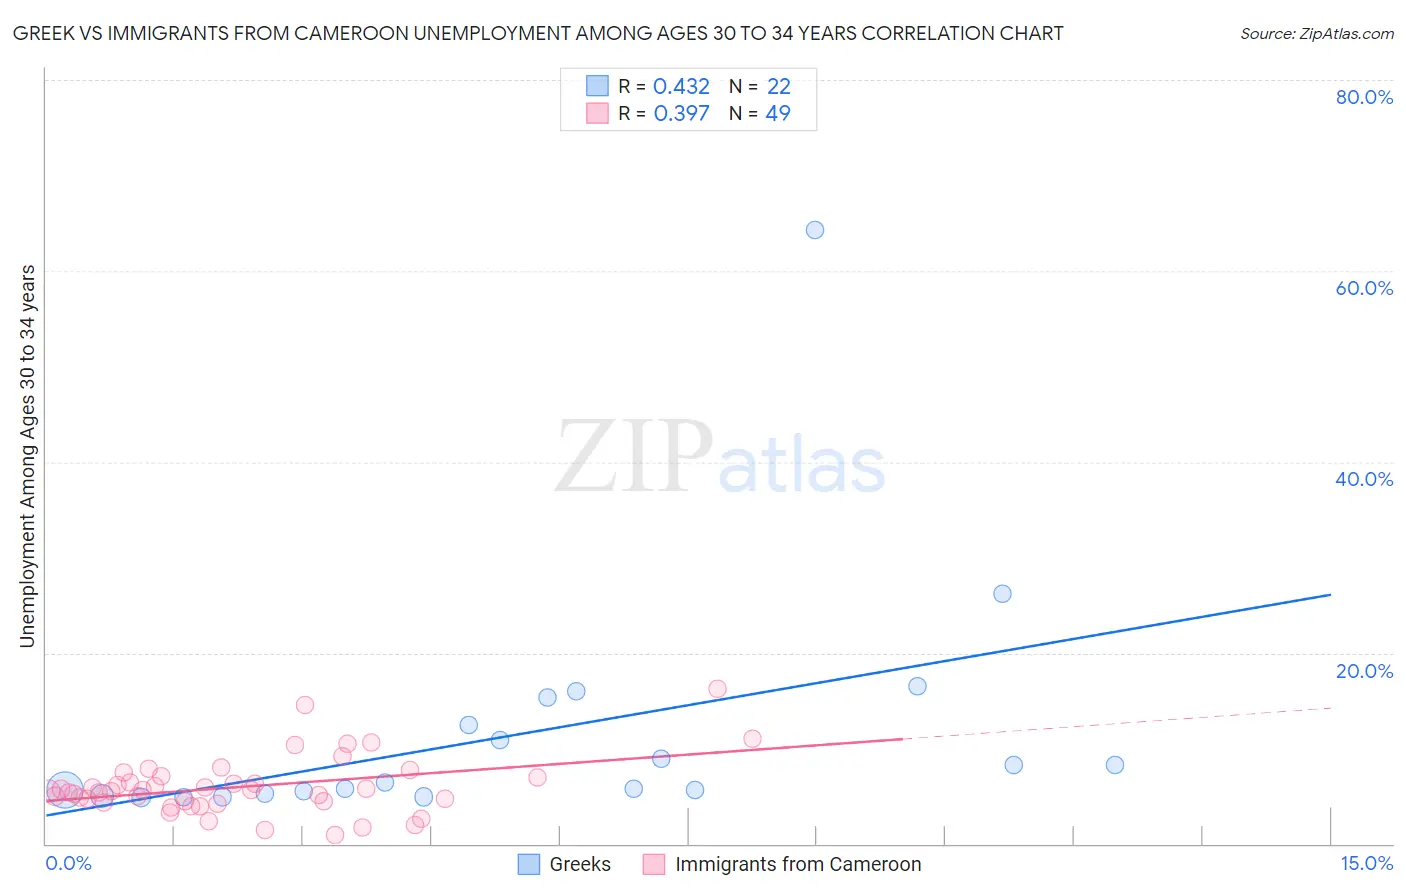
Greek vs Immigrants from Cameroon Unemployment Among Ages 30 to 34 years Correlation Chart
The statistical analysis conducted on geographies consisting of 442,229,062 people shows a moderate positive correlation between the proportion of Greeks and unemployment rate among population between the ages 30 and 34 in the United States with a correlation coefficient (R) of 0.432 and weighted average of 5.3%. Similarly, the statistical analysis conducted on geographies consisting of 128,849,811 people shows a mild positive correlation between the proportion of Immigrants from Cameroon and unemployment rate among population between the ages 30 and 34 in the United States with a correlation coefficient (R) of 0.397 and weighted average of 5.6%, a difference of 5.2%.
Unemployment Among Ages 30 to 34 years Correlation Summary
| Measurement | Greek | Immigrants from Cameroon |
| Minimum | 4.9% | 0.90% |
| Maximum | 64.3% | 16.3% |
| Range | 59.5% | 15.4% |
| Mean | 11.4% | 6.0% |
| Median | 6.1% | 5.5% |
| Interquartile 25% (IQ1) | 5.3% | 4.4% |
| Interquartile 75% (IQ3) | 12.5% | 7.0% |
| Interquartile Range (IQR) | 7.2% | 2.6% |
| Standard Deviation (Sample) | 13.0% | 3.0% |
| Standard Deviation (Population) | 12.7% | 3.0% |
Similar Demographics by Unemployment Among Ages 30 to 34 years
Demographics Similar to Greeks by Unemployment Among Ages 30 to 34 years
In terms of unemployment among ages 30 to 34 years, the demographic groups most similar to Greeks are Immigrants from Sri Lanka (5.3%, a difference of 0.020%), Immigrants from Brazil (5.3%, a difference of 0.050%), Immigrants from Italy (5.3%, a difference of 0.080%), Taiwanese (5.3%, a difference of 0.11%), and Immigrants from Uruguay (5.3%, a difference of 0.12%).
| Demographics | Rating | Rank | Unemployment Among Ages 30 to 34 years |
| Immigrants | South Africa | 83.0 /100 | #118 | Excellent 5.3% |
| New Zealanders | 82.5 /100 | #119 | Excellent 5.3% |
| Immigrants | Poland | 82.4 /100 | #120 | Excellent 5.3% |
| Romanians | 82.3 /100 | #121 | Excellent 5.3% |
| Immigrants | Netherlands | 81.8 /100 | #122 | Excellent 5.3% |
| Immigrants | Italy | 81.1 /100 | #123 | Excellent 5.3% |
| Immigrants | Brazil | 80.8 /100 | #124 | Excellent 5.3% |
| Greeks | 80.4 /100 | #125 | Excellent 5.3% |
| Immigrants | Sri Lanka | 80.2 /100 | #126 | Excellent 5.3% |
| Taiwanese | 79.4 /100 | #127 | Good 5.3% |
| Immigrants | Uruguay | 79.3 /100 | #128 | Good 5.3% |
| Poles | 78.8 /100 | #129 | Good 5.3% |
| Germans | 77.8 /100 | #130 | Good 5.3% |
| Immigrants | Eastern Europe | 77.4 /100 | #131 | Good 5.3% |
| Carpatho Rusyns | 77.3 /100 | #132 | Good 5.3% |
Demographics Similar to Immigrants from Cameroon by Unemployment Among Ages 30 to 34 years
In terms of unemployment among ages 30 to 34 years, the demographic groups most similar to Immigrants from Cameroon are Korean (5.6%, a difference of 0.25%), Immigrants from Germany (5.6%, a difference of 0.47%), Immigrants from Costa Rica (5.6%, a difference of 0.49%), Alsatian (5.6%, a difference of 0.50%), and South American Indian (5.6%, a difference of 0.61%).
| Demographics | Rating | Rank | Unemployment Among Ages 30 to 34 years |
| Immigrants | Nicaragua | 28.9 /100 | #197 | Fair 5.5% |
| Immigrants | Afghanistan | 27.2 /100 | #198 | Fair 5.6% |
| Nicaraguans | 26.6 /100 | #199 | Fair 5.6% |
| Immigrants | Southern Europe | 25.8 /100 | #200 | Fair 5.6% |
| South American Indians | 24.4 /100 | #201 | Fair 5.6% |
| Immigrants | Germany | 22.9 /100 | #202 | Fair 5.6% |
| Koreans | 20.7 /100 | #203 | Fair 5.6% |
| Immigrants | Cameroon | 18.4 /100 | #204 | Poor 5.6% |
| Immigrants | Costa Rica | 14.4 /100 | #205 | Poor 5.6% |
| Alsatians | 14.3 /100 | #206 | Poor 5.6% |
| Israelis | 12.8 /100 | #207 | Poor 5.6% |
| Immigrants | Philippines | 11.5 /100 | #208 | Poor 5.7% |
| French | 10.8 /100 | #209 | Poor 5.7% |
| Whites/Caucasians | 9.2 /100 | #210 | Tragic 5.7% |
| Spanish American Indians | 8.7 /100 | #211 | Tragic 5.7% |