Cypriot vs Immigrants from Poland Female Unemployment
COMPARE
Cypriot
Immigrants from Poland
Female Unemployment
Female Unemployment Comparison
Cypriots
Immigrants from Poland
4.7%
FEMALE UNEMPLOYMENT
99.9/ 100
METRIC RATING
29th/ 347
METRIC RANK
5.3%
FEMALE UNEMPLOYMENT
50.0/ 100
METRIC RATING
174th/ 347
METRIC RANK
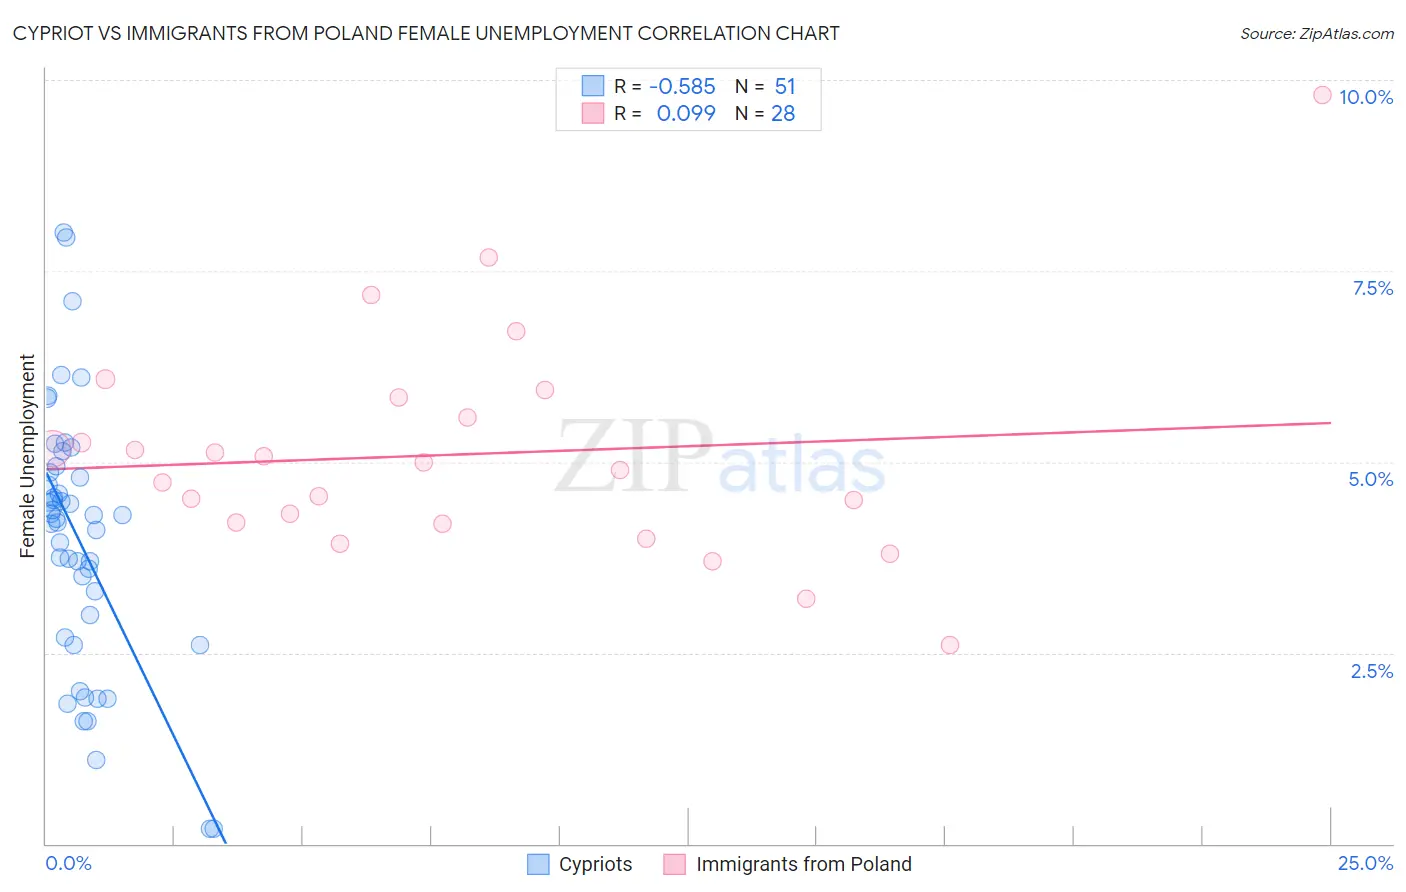
Cypriot vs Immigrants from Poland Female Unemployment Correlation Chart
The statistical analysis conducted on geographies consisting of 61,829,188 people shows a substantial negative correlation between the proportion of Cypriots and unemploymnet rate among females in the United States with a correlation coefficient (R) of -0.585 and weighted average of 4.7%. Similarly, the statistical analysis conducted on geographies consisting of 303,909,658 people shows a slight positive correlation between the proportion of Immigrants from Poland and unemploymnet rate among females in the United States with a correlation coefficient (R) of 0.099 and weighted average of 5.3%, a difference of 11.0%.
Female Unemployment Correlation Summary
| Measurement | Cypriot | Immigrants from Poland |
| Minimum | 0.20% | 2.6% |
| Maximum | 8.0% | 9.8% |
| Range | 7.8% | 7.2% |
| Mean | 4.0% | 5.1% |
| Median | 4.3% | 5.0% |
| Interquartile 25% (IQ1) | 2.7% | 4.2% |
| Interquartile 75% (IQ3) | 4.9% | 5.7% |
| Interquartile Range (IQR) | 2.2% | 1.5% |
| Standard Deviation (Sample) | 1.7% | 1.5% |
| Standard Deviation (Population) | 1.7% | 1.4% |
Similar Demographics by Female Unemployment
Demographics Similar to Cypriots by Female Unemployment
In terms of female unemployment, the demographic groups most similar to Cypriots are Irish (4.7%, a difference of 0.010%), British (4.7%, a difference of 0.040%), Lithuanian (4.7%, a difference of 0.12%), Immigrants from Bosnia and Herzegovina (4.7%, a difference of 0.20%), and Immigrants from India (4.7%, a difference of 0.24%).
| Demographics | Rating | Rank | Female Unemployment |
| Europeans | 99.9 /100 | #22 | Exceptional 4.7% |
| Scottish | 99.9 /100 | #23 | Exceptional 4.7% |
| Welsh | 99.9 /100 | #24 | Exceptional 4.7% |
| Immigrants | India | 99.9 /100 | #25 | Exceptional 4.7% |
| Immigrants | Bosnia and Herzegovina | 99.9 /100 | #26 | Exceptional 4.7% |
| British | 99.9 /100 | #27 | Exceptional 4.7% |
| Irish | 99.9 /100 | #28 | Exceptional 4.7% |
| Cypriots | 99.9 /100 | #29 | Exceptional 4.7% |
| Lithuanians | 99.8 /100 | #30 | Exceptional 4.7% |
| Sudanese | 99.8 /100 | #31 | Exceptional 4.8% |
| Slovaks | 99.8 /100 | #32 | Exceptional 4.8% |
| Czechoslovakians | 99.7 /100 | #33 | Exceptional 4.8% |
| Zimbabweans | 99.7 /100 | #34 | Exceptional 4.8% |
| French Canadians | 99.7 /100 | #35 | Exceptional 4.8% |
| Yugoslavians | 99.7 /100 | #36 | Exceptional 4.8% |
Demographics Similar to Immigrants from Poland by Female Unemployment
In terms of female unemployment, the demographic groups most similar to Immigrants from Poland are Iranian (5.3%, a difference of 0.020%), Immigrants from Uganda (5.3%, a difference of 0.040%), Immigrants from Laos (5.3%, a difference of 0.15%), Immigrants from Vietnam (5.3%, a difference of 0.15%), and Immigrants from Morocco (5.3%, a difference of 0.16%).
| Demographics | Rating | Rank | Female Unemployment |
| Immigrants | Thailand | 62.1 /100 | #167 | Good 5.2% |
| Sri Lankans | 59.4 /100 | #168 | Average 5.2% |
| Immigrants | Chile | 59.0 /100 | #169 | Average 5.2% |
| Spanish | 55.9 /100 | #170 | Average 5.2% |
| Immigrants | Denmark | 55.0 /100 | #171 | Average 5.2% |
| Immigrants | Uganda | 50.7 /100 | #172 | Average 5.3% |
| Iranians | 50.4 /100 | #173 | Average 5.3% |
| Immigrants | Poland | 50.0 /100 | #174 | Average 5.3% |
| Immigrants | Laos | 47.5 /100 | #175 | Average 5.3% |
| Immigrants | Vietnam | 47.5 /100 | #176 | Average 5.3% |
| Immigrants | Morocco | 47.4 /100 | #177 | Average 5.3% |
| Immigrants | Southern Europe | 46.2 /100 | #178 | Average 5.3% |
| Laotians | 45.1 /100 | #179 | Average 5.3% |
| Immigrants | Congo | 43.1 /100 | #180 | Average 5.3% |
| Taiwanese | 42.7 /100 | #181 | Average 5.3% |