Immigrants from Northern Africa vs Immigrants from Poland Female Unemployment
COMPARE
Immigrants from Northern Africa
Immigrants from Poland
Female Unemployment
Female Unemployment Comparison
Immigrants from Northern Africa
Immigrants from Poland
5.2%
FEMALE UNEMPLOYMENT
69.6/ 100
METRIC RATING
156th/ 347
METRIC RANK
5.3%
FEMALE UNEMPLOYMENT
50.0/ 100
METRIC RATING
174th/ 347
METRIC RANK
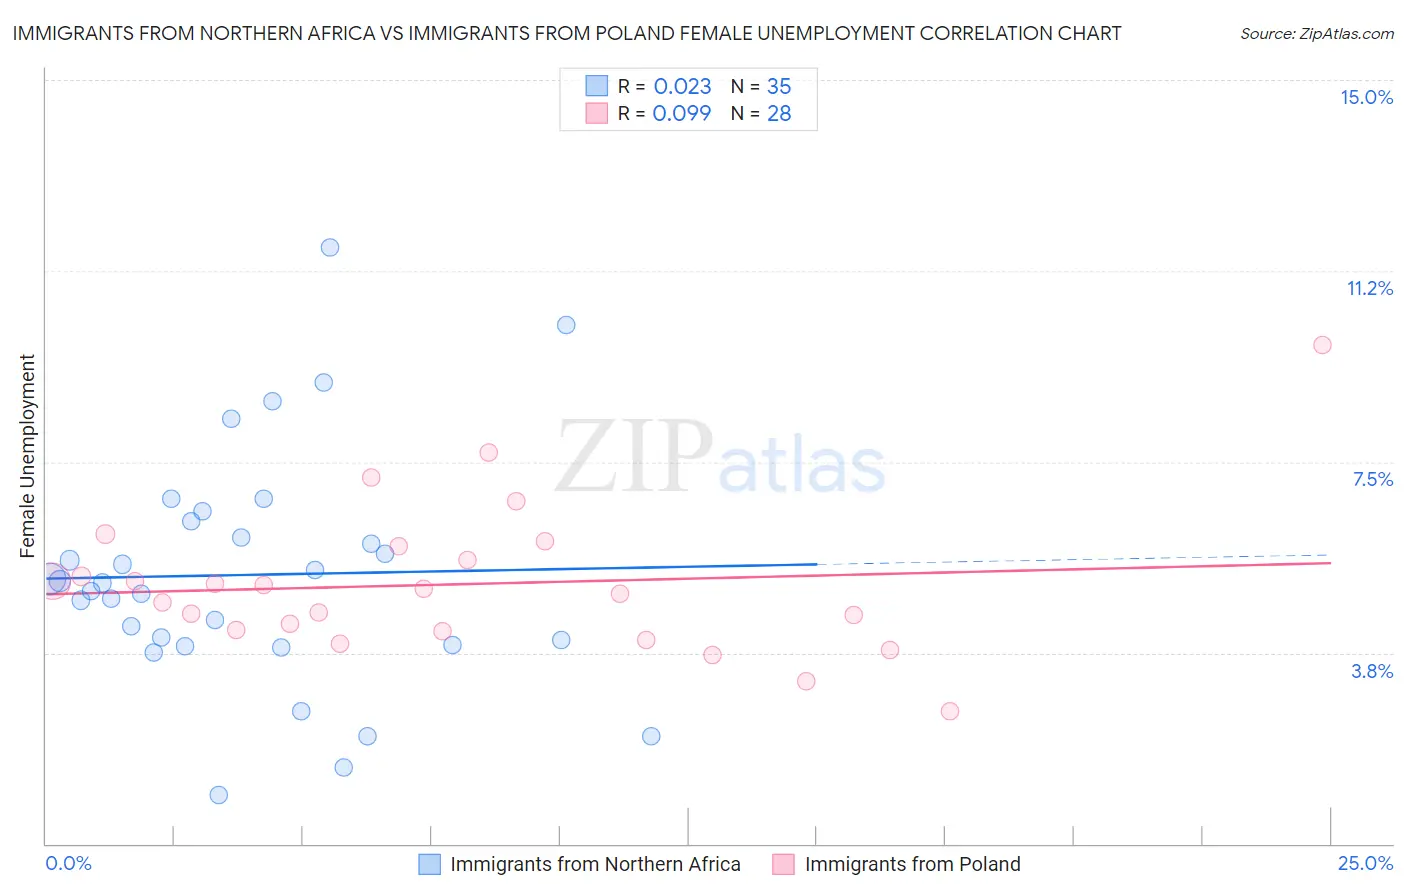
Immigrants from Northern Africa vs Immigrants from Poland Female Unemployment Correlation Chart
The statistical analysis conducted on geographies consisting of 320,534,342 people shows no correlation between the proportion of Immigrants from Northern Africa and unemploymnet rate among females in the United States with a correlation coefficient (R) of 0.023 and weighted average of 5.2%. Similarly, the statistical analysis conducted on geographies consisting of 303,909,658 people shows a slight positive correlation between the proportion of Immigrants from Poland and unemploymnet rate among females in the United States with a correlation coefficient (R) of 0.099 and weighted average of 5.3%, a difference of 1.3%.
Female Unemployment Correlation Summary
| Measurement | Immigrants from Northern Africa | Immigrants from Poland |
| Minimum | 0.96% | 2.6% |
| Maximum | 11.7% | 9.8% |
| Range | 10.7% | 7.2% |
| Mean | 5.3% | 5.1% |
| Median | 5.1% | 5.0% |
| Interquartile 25% (IQ1) | 3.9% | 4.2% |
| Interquartile 75% (IQ3) | 6.3% | 5.7% |
| Interquartile Range (IQR) | 2.4% | 1.5% |
| Standard Deviation (Sample) | 2.3% | 1.5% |
| Standard Deviation (Population) | 2.3% | 1.4% |
Demographics Similar to Immigrants from Northern Africa and Immigrants from Poland by Female Unemployment
In terms of female unemployment, the demographic groups most similar to Immigrants from Northern Africa are Immigrants from Russia (5.2%, a difference of 0.020%), Immigrants from Egypt (5.2%, a difference of 0.030%), Albanian (5.2%, a difference of 0.10%), Immigrants from Micronesia (5.2%, a difference of 0.19%), and Immigrants from Spain (5.2%, a difference of 0.20%). Similarly, the demographic groups most similar to Immigrants from Poland are Iranian (5.3%, a difference of 0.020%), Immigrants from Uganda (5.3%, a difference of 0.040%), Immigrants from Laos (5.3%, a difference of 0.15%), Immigrants from Denmark (5.2%, a difference of 0.30%), and Spanish (5.2%, a difference of 0.35%).
| Demographics | Rating | Rank | Female Unemployment |
| Immigrants | Egypt | 70.0 /100 | #155 | Good 5.2% |
| Immigrants | Northern Africa | 69.6 /100 | #156 | Good 5.2% |
| Immigrants | Russia | 69.3 /100 | #157 | Good 5.2% |
| Albanians | 68.3 /100 | #158 | Good 5.2% |
| Immigrants | Micronesia | 66.9 /100 | #159 | Good 5.2% |
| Immigrants | Spain | 66.8 /100 | #160 | Good 5.2% |
| Immigrants | Pakistan | 66.7 /100 | #161 | Good 5.2% |
| Potawatomi | 65.9 /100 | #162 | Good 5.2% |
| Immigrants | Asia | 64.3 /100 | #163 | Good 5.2% |
| Bangladeshis | 64.3 /100 | #164 | Good 5.2% |
| Syrians | 62.8 /100 | #165 | Good 5.2% |
| Native Hawaiians | 62.7 /100 | #166 | Good 5.2% |
| Immigrants | Thailand | 62.1 /100 | #167 | Good 5.2% |
| Sri Lankans | 59.4 /100 | #168 | Average 5.2% |
| Immigrants | Chile | 59.0 /100 | #169 | Average 5.2% |
| Spanish | 55.9 /100 | #170 | Average 5.2% |
| Immigrants | Denmark | 55.0 /100 | #171 | Average 5.2% |
| Immigrants | Uganda | 50.7 /100 | #172 | Average 5.3% |
| Iranians | 50.4 /100 | #173 | Average 5.3% |
| Immigrants | Poland | 50.0 /100 | #174 | Average 5.3% |
| Immigrants | Laos | 47.5 /100 | #175 | Average 5.3% |