German vs Spanish American Indian Unemployment Among Ages 60 to 64 years
COMPARE
German
Spanish American Indian
Unemployment Among Ages 60 to 64 years
Unemployment Among Ages 60 to 64 years Comparison
Germans
Spanish American Indians
4.5%
UNEMPLOYMENT AMONG AGES 60 TO 64 YEARS
100.0/ 100
METRIC RATING
35th/ 347
METRIC RANK
5.4%
UNEMPLOYMENT AMONG AGES 60 TO 64 YEARS
0.0/ 100
METRIC RATING
308th/ 347
METRIC RANK
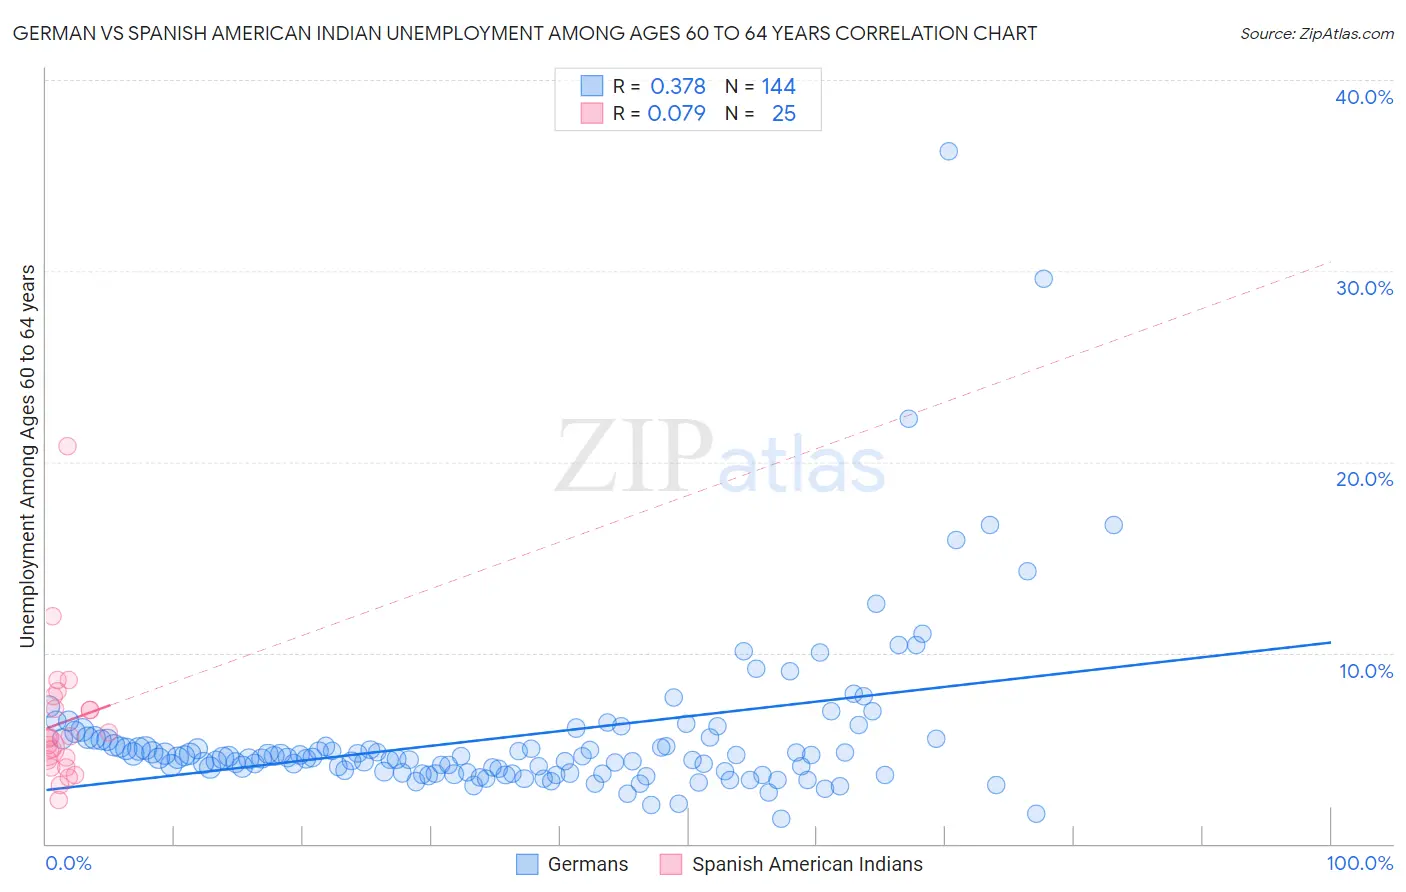
German vs Spanish American Indian Unemployment Among Ages 60 to 64 years Correlation Chart
The statistical analysis conducted on geographies consisting of 468,686,693 people shows a mild positive correlation between the proportion of Germans and unemployment rate among population between the ages 60 and 64 in the United States with a correlation coefficient (R) of 0.378 and weighted average of 4.5%. Similarly, the statistical analysis conducted on geographies consisting of 71,908,857 people shows a slight positive correlation between the proportion of Spanish American Indians and unemployment rate among population between the ages 60 and 64 in the United States with a correlation coefficient (R) of 0.079 and weighted average of 5.4%, a difference of 20.5%.
Unemployment Among Ages 60 to 64 years Correlation Summary
| Measurement | German | Spanish American Indian |
| Minimum | 1.3% | 2.3% |
| Maximum | 36.3% | 20.8% |
| Range | 34.9% | 18.5% |
| Mean | 5.6% | 6.3% |
| Median | 4.5% | 5.5% |
| Interquartile 25% (IQ1) | 3.7% | 4.2% |
| Interquartile 75% (IQ3) | 5.5% | 7.4% |
| Interquartile Range (IQR) | 1.8% | 3.2% |
| Standard Deviation (Sample) | 4.4% | 3.7% |
| Standard Deviation (Population) | 4.4% | 3.6% |
Similar Demographics by Unemployment Among Ages 60 to 64 years
Demographics Similar to Germans by Unemployment Among Ages 60 to 64 years
In terms of unemployment among ages 60 to 64 years, the demographic groups most similar to Germans are Venezuelan (4.5%, a difference of 0.010%), Belgian (4.5%, a difference of 0.020%), Immigrants from Portugal (4.5%, a difference of 0.040%), Native Hawaiian (4.5%, a difference of 0.24%), and Iraqi (4.5%, a difference of 0.24%).
| Demographics | Rating | Rank | Unemployment Among Ages 60 to 64 years |
| Immigrants | Nepal | 100.0 /100 | #28 | Exceptional 4.5% |
| Cubans | 100.0 /100 | #29 | Exceptional 4.5% |
| Immigrants | Venezuela | 100.0 /100 | #30 | Exceptional 4.5% |
| Immigrants | Eritrea | 100.0 /100 | #31 | Exceptional 4.5% |
| Zimbabweans | 100.0 /100 | #32 | Exceptional 4.5% |
| Carpatho Rusyns | 100.0 /100 | #33 | Exceptional 4.5% |
| Belgians | 100.0 /100 | #34 | Exceptional 4.5% |
| Germans | 100.0 /100 | #35 | Exceptional 4.5% |
| Venezuelans | 100.0 /100 | #36 | Exceptional 4.5% |
| Immigrants | Portugal | 100.0 /100 | #37 | Exceptional 4.5% |
| Native Hawaiians | 100.0 /100 | #38 | Exceptional 4.5% |
| Iraqis | 100.0 /100 | #39 | Exceptional 4.5% |
| Scandinavians | 100.0 /100 | #40 | Exceptional 4.5% |
| Immigrants | Sudan | 100.0 /100 | #41 | Exceptional 4.5% |
| English | 100.0 /100 | #42 | Exceptional 4.5% |
Demographics Similar to Spanish American Indians by Unemployment Among Ages 60 to 64 years
In terms of unemployment among ages 60 to 64 years, the demographic groups most similar to Spanish American Indians are Soviet Union (5.4%, a difference of 0.010%), Immigrants from Guyana (5.4%, a difference of 0.020%), Immigrants from Dominica (5.4%, a difference of 0.18%), Cypriot (5.4%, a difference of 0.25%), and Immigrants from Mexico (5.4%, a difference of 0.27%).
| Demographics | Rating | Rank | Unemployment Among Ages 60 to 64 years |
| Immigrants | Jamaica | 0.0 /100 | #301 | Tragic 5.4% |
| Barbadians | 0.0 /100 | #302 | Tragic 5.4% |
| Bahamians | 0.0 /100 | #303 | Tragic 5.4% |
| Immigrants | Mexico | 0.0 /100 | #304 | Tragic 5.4% |
| Cypriots | 0.0 /100 | #305 | Tragic 5.4% |
| Immigrants | Dominica | 0.0 /100 | #306 | Tragic 5.4% |
| Immigrants | Guyana | 0.0 /100 | #307 | Tragic 5.4% |
| Spanish American Indians | 0.0 /100 | #308 | Tragic 5.4% |
| Soviet Union | 0.0 /100 | #309 | Tragic 5.4% |
| British West Indians | 0.0 /100 | #310 | Tragic 5.5% |
| U.S. Virgin Islanders | 0.0 /100 | #311 | Tragic 5.5% |
| Immigrants | West Indies | 0.0 /100 | #312 | Tragic 5.5% |
| Belizeans | 0.0 /100 | #313 | Tragic 5.5% |
| Guyanese | 0.0 /100 | #314 | Tragic 5.5% |
| Cree | 0.0 /100 | #315 | Tragic 5.6% |