Tongan vs Immigrants from Indonesia Unemployment Among Women with Children Under 6 years
COMPARE
Tongan
Immigrants from Indonesia
Unemployment Among Women with Children Under 6 years
Unemployment Among Women with Children Under 6 years Comparison
Tongans
Immigrants from Indonesia
6.9%
UNEMPLOYMENT AMONG WOMEN WITH CHILDREN UNDER 6 YEARS
99.7/ 100
METRIC RATING
64th/ 347
METRIC RANK
6.7%
UNEMPLOYMENT AMONG WOMEN WITH CHILDREN UNDER 6 YEARS
99.9/ 100
METRIC RATING
41st/ 347
METRIC RANK
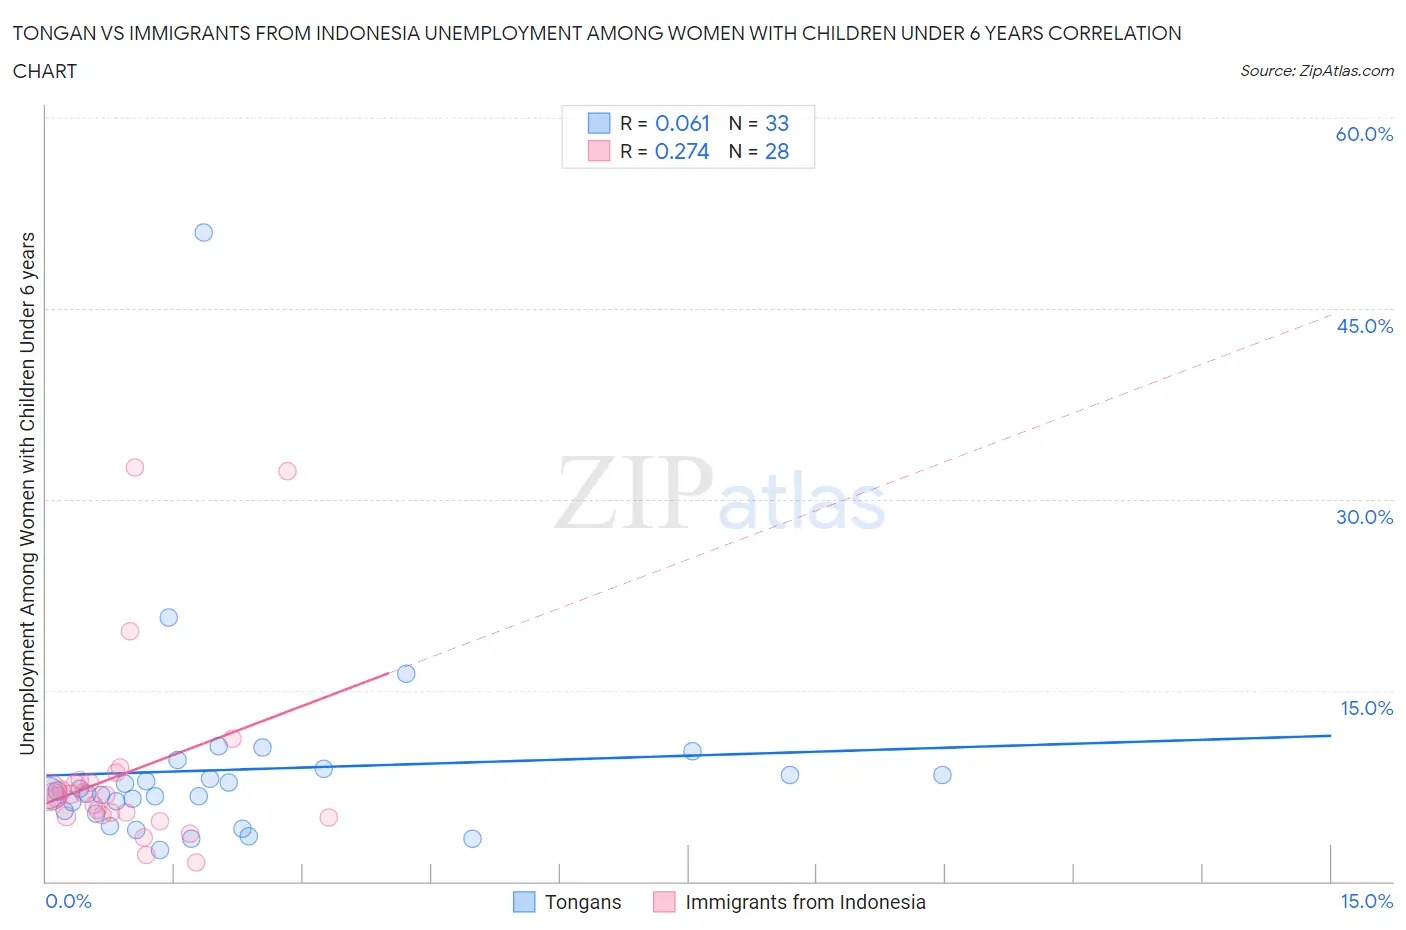
Tongan vs Immigrants from Indonesia Unemployment Among Women with Children Under 6 years Correlation Chart
The statistical analysis conducted on geographies consisting of 92,875,365 people shows a slight positive correlation between the proportion of Tongans and unemployment rate among women with children under the age of 6 in the United States with a correlation coefficient (R) of 0.061 and weighted average of 6.9%. Similarly, the statistical analysis conducted on geographies consisting of 184,987,749 people shows a weak positive correlation between the proportion of Immigrants from Indonesia and unemployment rate among women with children under the age of 6 in the United States with a correlation coefficient (R) of 0.274 and weighted average of 6.7%, a difference of 3.5%.
Unemployment Among Women with Children Under 6 years Correlation Summary
| Measurement | Tongan | Immigrants from Indonesia |
| Minimum | 2.5% | 1.5% |
| Maximum | 51.0% | 32.5% |
| Range | 48.5% | 31.0% |
| Mean | 8.8% | 8.5% |
| Median | 6.9% | 6.7% |
| Interquartile 25% (IQ1) | 5.4% | 5.2% |
| Interquartile 75% (IQ3) | 8.6% | 7.9% |
| Interquartile Range (IQR) | 3.1% | 2.7% |
| Standard Deviation (Sample) | 8.4% | 7.5% |
| Standard Deviation (Population) | 8.3% | 7.3% |
Similar Demographics by Unemployment Among Women with Children Under 6 years
Demographics Similar to Tongans by Unemployment Among Women with Children Under 6 years
In terms of unemployment among women with children under 6 years, the demographic groups most similar to Tongans are Maltese (6.9%, a difference of 0.10%), Somali (6.9%, a difference of 0.15%), Immigrants from Kuwait (6.9%, a difference of 0.15%), Immigrants from France (6.9%, a difference of 0.19%), and Immigrants from Belgium (6.9%, a difference of 0.37%).
| Demographics | Rating | Rank | Unemployment Among Women with Children Under 6 years |
| Icelanders | 99.8 /100 | #57 | Exceptional 6.9% |
| Immigrants | Turkey | 99.8 /100 | #58 | Exceptional 6.9% |
| Immigrants | Serbia | 99.8 /100 | #59 | Exceptional 6.9% |
| Immigrants | Sri Lanka | 99.8 /100 | #60 | Exceptional 6.9% |
| Immigrants | France | 99.7 /100 | #61 | Exceptional 6.9% |
| Somalis | 99.7 /100 | #62 | Exceptional 6.9% |
| Maltese | 99.7 /100 | #63 | Exceptional 6.9% |
| Tongans | 99.7 /100 | #64 | Exceptional 6.9% |
| Immigrants | Kuwait | 99.7 /100 | #65 | Exceptional 6.9% |
| Immigrants | Belgium | 99.6 /100 | #66 | Exceptional 6.9% |
| Immigrants | Netherlands | 99.5 /100 | #67 | Exceptional 7.0% |
| Paraguayans | 99.4 /100 | #68 | Exceptional 7.0% |
| Immigrants | Eritrea | 99.4 /100 | #69 | Exceptional 7.0% |
| Immigrants | Iraq | 99.4 /100 | #70 | Exceptional 7.0% |
| Afghans | 99.4 /100 | #71 | Exceptional 7.0% |
Demographics Similar to Immigrants from Indonesia by Unemployment Among Women with Children Under 6 years
In terms of unemployment among women with children under 6 years, the demographic groups most similar to Immigrants from Indonesia are Immigrants from Cuba (6.7%, a difference of 0.10%), Asian (6.7%, a difference of 0.16%), Immigrants from Russia (6.7%, a difference of 0.37%), Bhutanese (6.7%, a difference of 0.38%), and Hmong (6.7%, a difference of 0.44%).
| Demographics | Rating | Rank | Unemployment Among Women with Children Under 6 years |
| Immigrants | South Central Asia | 100.0 /100 | #34 | Exceptional 6.6% |
| Yakama | 100.0 /100 | #35 | Exceptional 6.6% |
| Luxembourgers | 100.0 /100 | #36 | Exceptional 6.6% |
| Sri Lankans | 100.0 /100 | #37 | Exceptional 6.6% |
| Hmong | 100.0 /100 | #38 | Exceptional 6.7% |
| Immigrants | Russia | 100.0 /100 | #39 | Exceptional 6.7% |
| Asians | 100.0 /100 | #40 | Exceptional 6.7% |
| Immigrants | Indonesia | 99.9 /100 | #41 | Exceptional 6.7% |
| Immigrants | Cuba | 99.9 /100 | #42 | Exceptional 6.7% |
| Bhutanese | 99.9 /100 | #43 | Exceptional 6.7% |
| Iranians | 99.9 /100 | #44 | Exceptional 6.7% |
| Immigrants | Australia | 99.9 /100 | #45 | Exceptional 6.8% |
| Latvians | 99.9 /100 | #46 | Exceptional 6.8% |
| Immigrants | Asia | 99.9 /100 | #47 | Exceptional 6.8% |
| Immigrants | Switzerland | 99.9 /100 | #48 | Exceptional 6.8% |