German vs Burmese Unemployment Among Ages 45 to 54 years
COMPARE
German
Burmese
Unemployment Among Ages 45 to 54 years
Unemployment Among Ages 45 to 54 years Comparison
Germans
Burmese
4.1%
UNEMPLOYMENT AMONG AGES 45 TO 54 YEARS
100.0/ 100
METRIC RATING
18th/ 347
METRIC RANK
4.2%
UNEMPLOYMENT AMONG AGES 45 TO 54 YEARS
99.6/ 100
METRIC RATING
51st/ 347
METRIC RANK
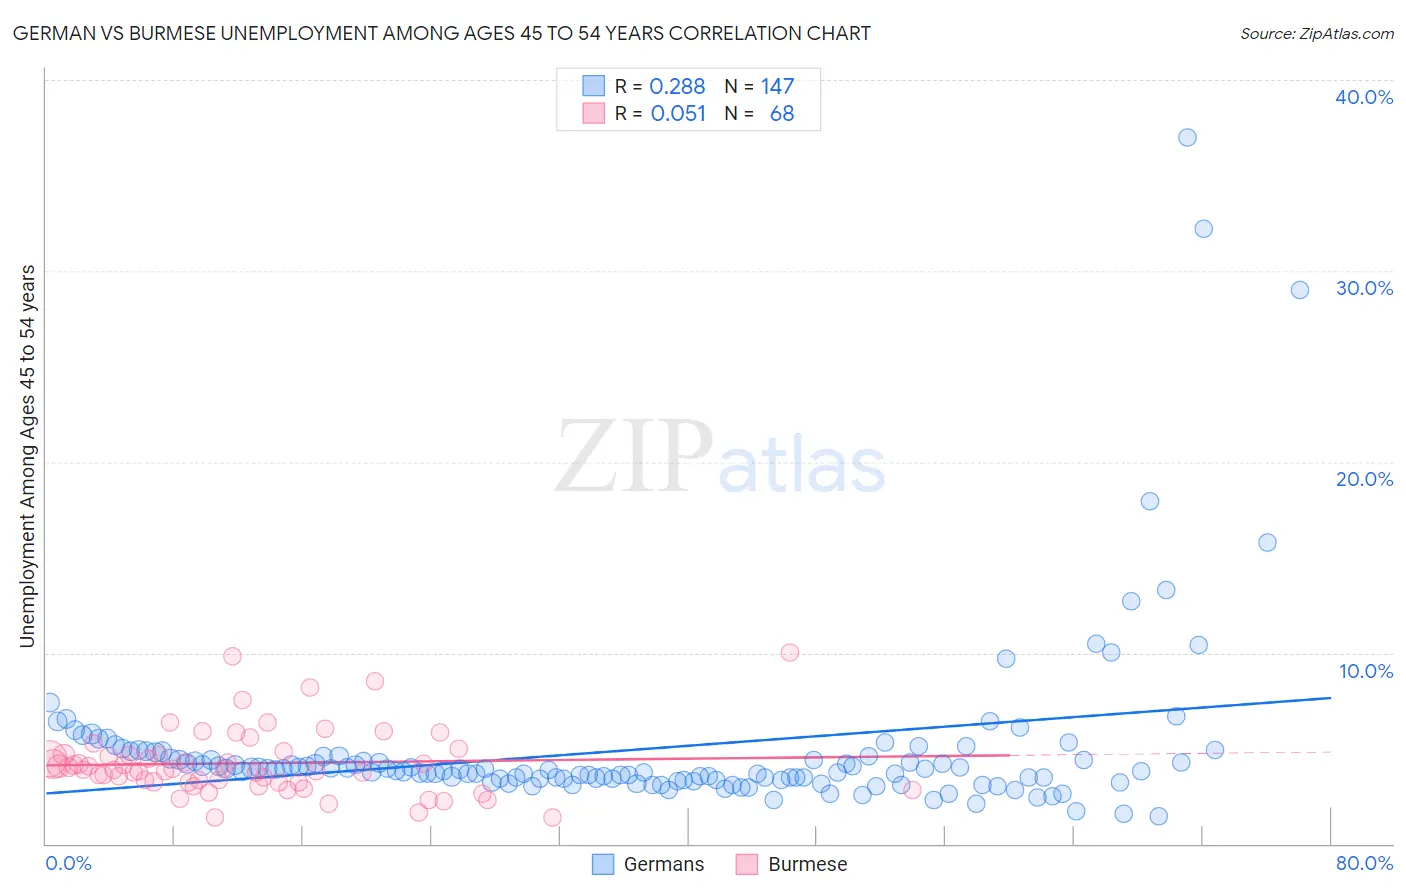
German vs Burmese Unemployment Among Ages 45 to 54 years Correlation Chart
The statistical analysis conducted on geographies consisting of 533,496,511 people shows a weak positive correlation between the proportion of Germans and unemployment rate among population between the ages 45 and 54 in the United States with a correlation coefficient (R) of 0.288 and weighted average of 4.1%. Similarly, the statistical analysis conducted on geographies consisting of 448,611,783 people shows a slight positive correlation between the proportion of Burmese and unemployment rate among population between the ages 45 and 54 in the United States with a correlation coefficient (R) of 0.051 and weighted average of 4.2%, a difference of 4.3%.
Unemployment Among Ages 45 to 54 years Correlation Summary
| Measurement | German | Burmese |
| Minimum | 1.4% | 1.4% |
| Maximum | 37.0% | 10.0% |
| Range | 35.6% | 8.6% |
| Mean | 4.9% | 4.2% |
| Median | 3.9% | 3.9% |
| Interquartile 25% (IQ1) | 3.4% | 3.2% |
| Interquartile 75% (IQ3) | 4.6% | 4.7% |
| Interquartile Range (IQR) | 1.2% | 1.5% |
| Standard Deviation (Sample) | 4.7% | 1.7% |
| Standard Deviation (Population) | 4.6% | 1.7% |
Similar Demographics by Unemployment Among Ages 45 to 54 years
Demographics Similar to Germans by Unemployment Among Ages 45 to 54 years
In terms of unemployment among ages 45 to 54 years, the demographic groups most similar to Germans are Tongan (4.1%, a difference of 0.020%), Swiss (4.1%, a difference of 0.29%), English (4.1%, a difference of 0.45%), Thai (4.0%, a difference of 0.56%), and Immigrants from Bolivia (4.0%, a difference of 0.76%).
| Demographics | Rating | Rank | Unemployment Among Ages 45 to 54 years |
| Scandinavians | 100.0 /100 | #11 | Exceptional 4.0% |
| Swedes | 100.0 /100 | #12 | Exceptional 4.0% |
| Cubans | 100.0 /100 | #13 | Exceptional 4.0% |
| Immigrants | Bosnia and Herzegovina | 100.0 /100 | #14 | Exceptional 4.0% |
| Immigrants | Bolivia | 100.0 /100 | #15 | Exceptional 4.0% |
| Thais | 100.0 /100 | #16 | Exceptional 4.0% |
| Tongans | 100.0 /100 | #17 | Exceptional 4.1% |
| Germans | 100.0 /100 | #18 | Exceptional 4.1% |
| Swiss | 100.0 /100 | #19 | Exceptional 4.1% |
| English | 100.0 /100 | #20 | Exceptional 4.1% |
| Europeans | 100.0 /100 | #21 | Exceptional 4.1% |
| Yugoslavians | 100.0 /100 | #22 | Exceptional 4.1% |
| Bulgarians | 100.0 /100 | #23 | Exceptional 4.1% |
| Carpatho Rusyns | 100.0 /100 | #24 | Exceptional 4.1% |
| Bolivians | 99.9 /100 | #25 | Exceptional 4.1% |
Demographics Similar to Burmese by Unemployment Among Ages 45 to 54 years
In terms of unemployment among ages 45 to 54 years, the demographic groups most similar to Burmese are Immigrants from Zimbabwe (4.2%, a difference of 0.010%), Basque (4.2%, a difference of 0.010%), Finnish (4.2%, a difference of 0.050%), Filipino (4.2%, a difference of 0.12%), and Luxembourger (4.2%, a difference of 0.13%).
| Demographics | Rating | Rank | Unemployment Among Ages 45 to 54 years |
| Immigrants | Singapore | 99.7 /100 | #44 | Exceptional 4.2% |
| Immigrants | Bulgaria | 99.7 /100 | #45 | Exceptional 4.2% |
| Luxembourgers | 99.6 /100 | #46 | Exceptional 4.2% |
| Filipinos | 99.6 /100 | #47 | Exceptional 4.2% |
| Finns | 99.6 /100 | #48 | Exceptional 4.2% |
| Immigrants | Zimbabwe | 99.6 /100 | #49 | Exceptional 4.2% |
| Basques | 99.6 /100 | #50 | Exceptional 4.2% |
| Burmese | 99.6 /100 | #51 | Exceptional 4.2% |
| Poles | 99.5 /100 | #52 | Exceptional 4.2% |
| Irish | 99.5 /100 | #53 | Exceptional 4.2% |
| Chickasaw | 99.5 /100 | #54 | Exceptional 4.2% |
| Latvians | 99.4 /100 | #55 | Exceptional 4.2% |
| Immigrants | Jordan | 99.3 /100 | #56 | Exceptional 4.3% |
| Immigrants | Sri Lanka | 99.3 /100 | #57 | Exceptional 4.3% |
| Greeks | 99.3 /100 | #58 | Exceptional 4.3% |