German vs Burmese High School Diploma
COMPARE
German
Burmese
High School Diploma
High School Diploma Comparison
Germans
Burmese
91.7%
HIGH SCHOOL DIPLOMA
99.9/ 100
METRIC RATING
18th/ 347
METRIC RANK
90.8%
HIGH SCHOOL DIPLOMA
99.3/ 100
METRIC RATING
78th/ 347
METRIC RANK
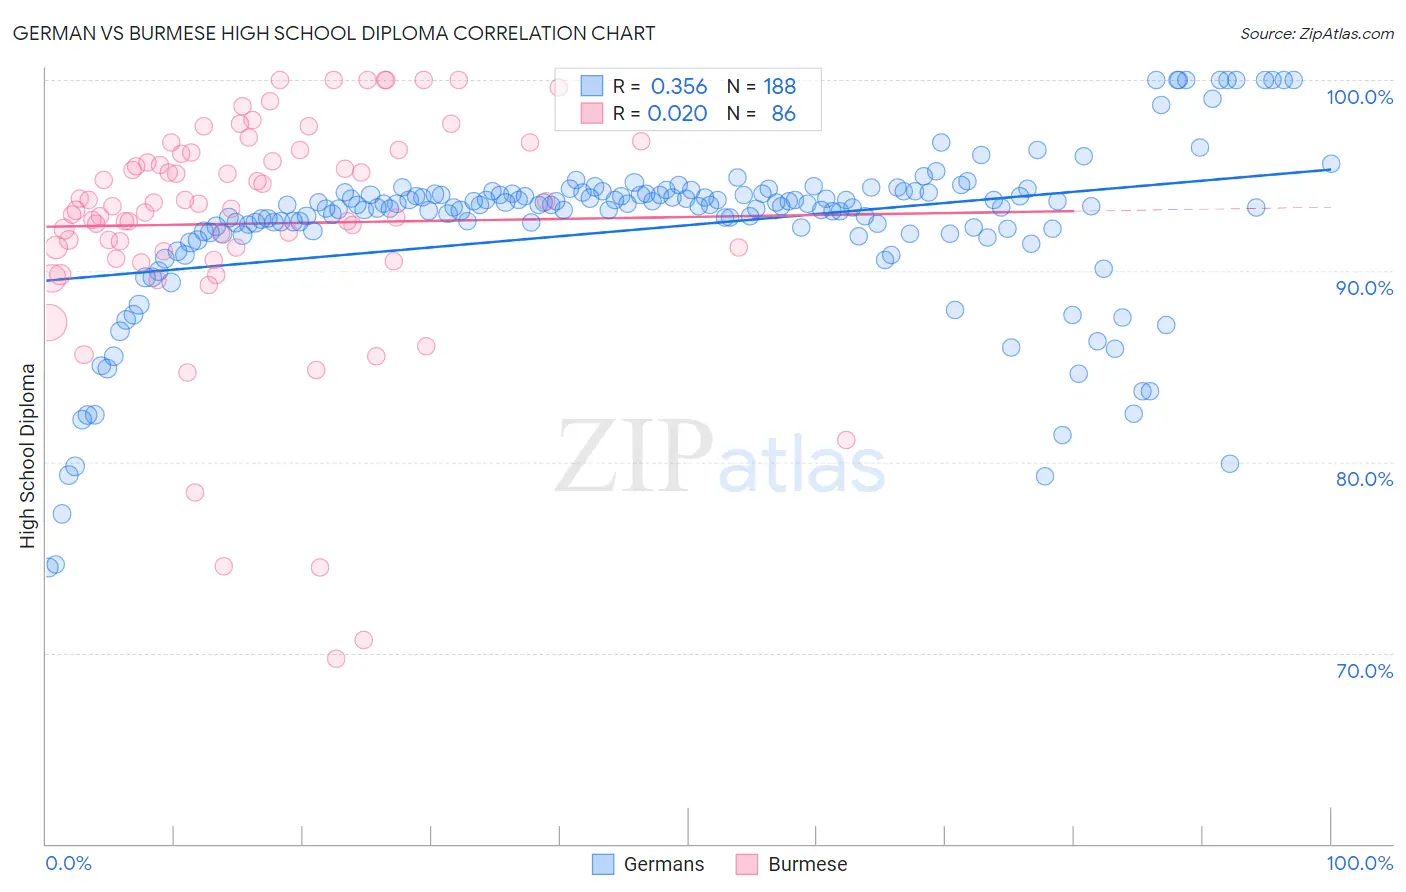
German vs Burmese High School Diploma Correlation Chart
The statistical analysis conducted on geographies consisting of 581,301,082 people shows a mild positive correlation between the proportion of Germans and percentage of population with at least high school diploma education in the United States with a correlation coefficient (R) of 0.356 and weighted average of 91.7%. Similarly, the statistical analysis conducted on geographies consisting of 465,407,978 people shows no correlation between the proportion of Burmese and percentage of population with at least high school diploma education in the United States with a correlation coefficient (R) of 0.020 and weighted average of 90.8%, a difference of 0.95%.
High School Diploma Correlation Summary
| Measurement | German | Burmese |
| Minimum | 74.5% | 69.7% |
| Maximum | 100.0% | 100.0% |
| Range | 25.5% | 30.3% |
| Mean | 92.2% | 92.5% |
| Median | 93.4% | 93.3% |
| Interquartile 25% (IQ1) | 91.9% | 91.0% |
| Interquartile 75% (IQ3) | 94.0% | 96.2% |
| Interquartile Range (IQR) | 2.1% | 5.1% |
| Standard Deviation (Sample) | 4.5% | 6.2% |
| Standard Deviation (Population) | 4.5% | 6.1% |
Similar Demographics by High School Diploma
Demographics Similar to Germans by High School Diploma
In terms of high school diploma, the demographic groups most similar to Germans are Immigrants from Singapore (91.7%, a difference of 0.010%), Finnish (91.7%, a difference of 0.050%), Luxembourger (91.7%, a difference of 0.070%), Maltese (91.6%, a difference of 0.080%), and Bulgarian (91.8%, a difference of 0.10%).
| Demographics | Rating | Rank | High School Diploma |
| Eastern Europeans | 100.0 /100 | #11 | Exceptional 91.9% |
| Poles | 100.0 /100 | #12 | Exceptional 91.9% |
| Danes | 100.0 /100 | #13 | Exceptional 91.8% |
| Bulgarians | 100.0 /100 | #14 | Exceptional 91.8% |
| Luxembourgers | 100.0 /100 | #15 | Exceptional 91.7% |
| Finns | 100.0 /100 | #16 | Exceptional 91.7% |
| Immigrants | Singapore | 99.9 /100 | #17 | Exceptional 91.7% |
| Germans | 99.9 /100 | #18 | Exceptional 91.7% |
| Maltese | 99.9 /100 | #19 | Exceptional 91.6% |
| Czechs | 99.9 /100 | #20 | Exceptional 91.6% |
| Filipinos | 99.9 /100 | #21 | Exceptional 91.6% |
| Estonians | 99.9 /100 | #22 | Exceptional 91.6% |
| Scandinavians | 99.9 /100 | #23 | Exceptional 91.5% |
| Italians | 99.9 /100 | #24 | Exceptional 91.5% |
| Thais | 99.9 /100 | #25 | Exceptional 91.5% |
Demographics Similar to Burmese by High School Diploma
In terms of high school diploma, the demographic groups most similar to Burmese are Native Hawaiian (90.8%, a difference of 0.0%), Hungarian (90.8%, a difference of 0.010%), Immigrants from Denmark (90.8%, a difference of 0.010%), Cambodian (90.8%, a difference of 0.020%), and Immigrants from England (90.8%, a difference of 0.020%).
| Demographics | Rating | Rank | High School Diploma |
| Alaskan Athabascans | 99.4 /100 | #71 | Exceptional 90.9% |
| Soviet Union | 99.4 /100 | #72 | Exceptional 90.9% |
| Immigrants | South Central Asia | 99.4 /100 | #73 | Exceptional 90.9% |
| Immigrants | Czechoslovakia | 99.4 /100 | #74 | Exceptional 90.9% |
| Cambodians | 99.4 /100 | #75 | Exceptional 90.8% |
| Hungarians | 99.3 /100 | #76 | Exceptional 90.8% |
| Native Hawaiians | 99.3 /100 | #77 | Exceptional 90.8% |
| Burmese | 99.3 /100 | #78 | Exceptional 90.8% |
| Immigrants | Denmark | 99.3 /100 | #79 | Exceptional 90.8% |
| Immigrants | England | 99.3 /100 | #80 | Exceptional 90.8% |
| Immigrants | Switzerland | 99.3 /100 | #81 | Exceptional 90.8% |
| Scotch-Irish | 99.2 /100 | #82 | Exceptional 90.8% |
| Immigrants | Moldova | 99.2 /100 | #83 | Exceptional 90.7% |
| Immigrants | Saudi Arabia | 99.1 /100 | #84 | Exceptional 90.7% |
| Romanians | 98.9 /100 | #85 | Exceptional 90.7% |