German vs Crow Unemployment Among Ages 45 to 54 years
COMPARE
German
Crow
Unemployment Among Ages 45 to 54 years
Unemployment Among Ages 45 to 54 years Comparison
Germans
Crow
4.1%
UNEMPLOYMENT AMONG AGES 45 TO 54 YEARS
100.0/ 100
METRIC RATING
18th/ 347
METRIC RANK
13.7%
UNEMPLOYMENT AMONG AGES 45 TO 54 YEARS
0.0/ 100
METRIC RATING
347th/ 347
METRIC RANK
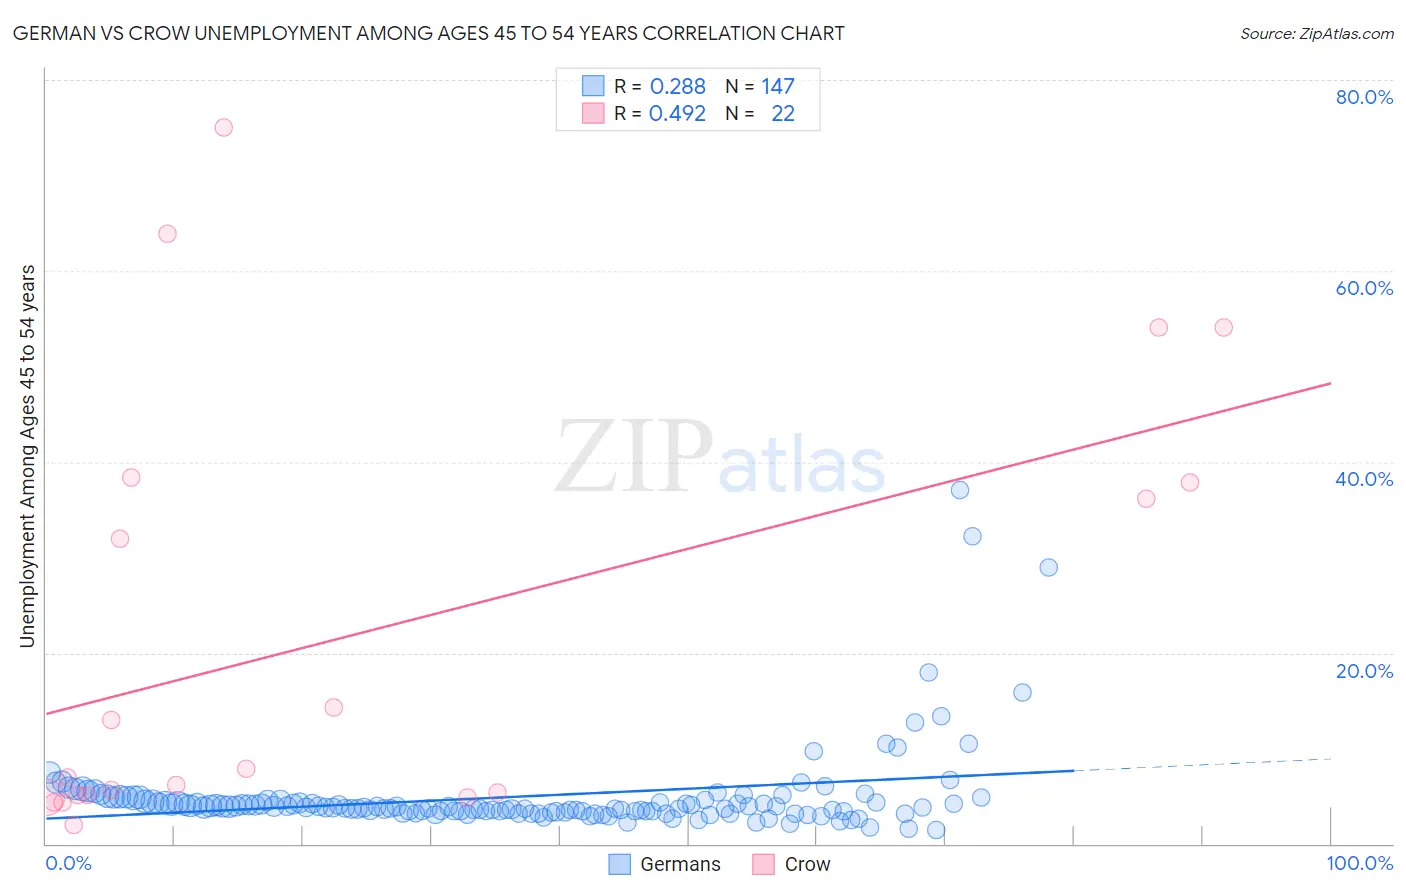
German vs Crow Unemployment Among Ages 45 to 54 years Correlation Chart
The statistical analysis conducted on geographies consisting of 533,496,511 people shows a weak positive correlation between the proportion of Germans and unemployment rate among population between the ages 45 and 54 in the United States with a correlation coefficient (R) of 0.288 and weighted average of 4.1%. Similarly, the statistical analysis conducted on geographies consisting of 58,625,071 people shows a moderate positive correlation between the proportion of Crow and unemployment rate among population between the ages 45 and 54 in the United States with a correlation coefficient (R) of 0.492 and weighted average of 13.7%, a difference of 239.0%.
Unemployment Among Ages 45 to 54 years Correlation Summary
| Measurement | German | Crow |
| Minimum | 1.4% | 1.9% |
| Maximum | 37.0% | 75.0% |
| Range | 35.6% | 73.1% |
| Mean | 4.9% | 21.9% |
| Median | 3.9% | 7.4% |
| Interquartile 25% (IQ1) | 3.4% | 5.0% |
| Interquartile 75% (IQ3) | 4.6% | 37.8% |
| Interquartile Range (IQR) | 1.2% | 32.8% |
| Standard Deviation (Sample) | 4.7% | 22.9% |
| Standard Deviation (Population) | 4.6% | 22.4% |
Similar Demographics by Unemployment Among Ages 45 to 54 years
Demographics Similar to Germans by Unemployment Among Ages 45 to 54 years
In terms of unemployment among ages 45 to 54 years, the demographic groups most similar to Germans are Tongan (4.1%, a difference of 0.020%), Swiss (4.1%, a difference of 0.29%), English (4.1%, a difference of 0.45%), Thai (4.0%, a difference of 0.56%), and Immigrants from Bolivia (4.0%, a difference of 0.76%).
| Demographics | Rating | Rank | Unemployment Among Ages 45 to 54 years |
| Scandinavians | 100.0 /100 | #11 | Exceptional 4.0% |
| Swedes | 100.0 /100 | #12 | Exceptional 4.0% |
| Cubans | 100.0 /100 | #13 | Exceptional 4.0% |
| Immigrants | Bosnia and Herzegovina | 100.0 /100 | #14 | Exceptional 4.0% |
| Immigrants | Bolivia | 100.0 /100 | #15 | Exceptional 4.0% |
| Thais | 100.0 /100 | #16 | Exceptional 4.0% |
| Tongans | 100.0 /100 | #17 | Exceptional 4.1% |
| Germans | 100.0 /100 | #18 | Exceptional 4.1% |
| Swiss | 100.0 /100 | #19 | Exceptional 4.1% |
| English | 100.0 /100 | #20 | Exceptional 4.1% |
| Europeans | 100.0 /100 | #21 | Exceptional 4.1% |
| Yugoslavians | 100.0 /100 | #22 | Exceptional 4.1% |
| Bulgarians | 100.0 /100 | #23 | Exceptional 4.1% |
| Carpatho Rusyns | 100.0 /100 | #24 | Exceptional 4.1% |
| Bolivians | 99.9 /100 | #25 | Exceptional 4.1% |
Demographics Similar to Crow by Unemployment Among Ages 45 to 54 years
In terms of unemployment among ages 45 to 54 years, the demographic groups most similar to Crow are Yup'ik (11.9%, a difference of 15.7%), Cheyenne (10.6%, a difference of 30.1%), Yuman (9.5%, a difference of 44.8%), Inupiat (9.2%, a difference of 49.6%), and Alaskan Athabascan (8.5%, a difference of 62.4%).
| Demographics | Rating | Rank | Unemployment Among Ages 45 to 54 years |
| Immigrants | Yemen | 0.0 /100 | #333 | Tragic 6.5% |
| Sioux | 0.0 /100 | #334 | Tragic 6.6% |
| Navajo | 0.0 /100 | #335 | Tragic 6.7% |
| Puerto Ricans | 0.0 /100 | #336 | Tragic 6.8% |
| Apache | 0.0 /100 | #337 | Tragic 7.0% |
| Colville | 0.0 /100 | #338 | Tragic 7.4% |
| Arapaho | 0.0 /100 | #339 | Tragic 7.5% |
| Hopi | 0.0 /100 | #340 | Tragic 7.5% |
| Paiute | 0.0 /100 | #341 | Tragic 7.8% |
| Alaskan Athabascans | 0.0 /100 | #342 | Tragic 8.5% |
| Inupiat | 0.0 /100 | #343 | Tragic 9.2% |
| Yuman | 0.0 /100 | #344 | Tragic 9.5% |
| Cheyenne | 0.0 /100 | #345 | Tragic 10.6% |
| Yup'ik | 0.0 /100 | #346 | Tragic 11.9% |
| Crow | 0.0 /100 | #347 | Tragic 13.7% |