French vs Immigrants from Philippines 9th Grade
COMPARE
French
Immigrants from Philippines
9th Grade
9th Grade Comparison
French
Immigrants from Philippines
96.3%
9TH GRADE
100.0/ 100
METRIC RATING
25th/ 347
METRIC RANK
93.7%
9TH GRADE
0.1/ 100
METRIC RATING
277th/ 347
METRIC RANK
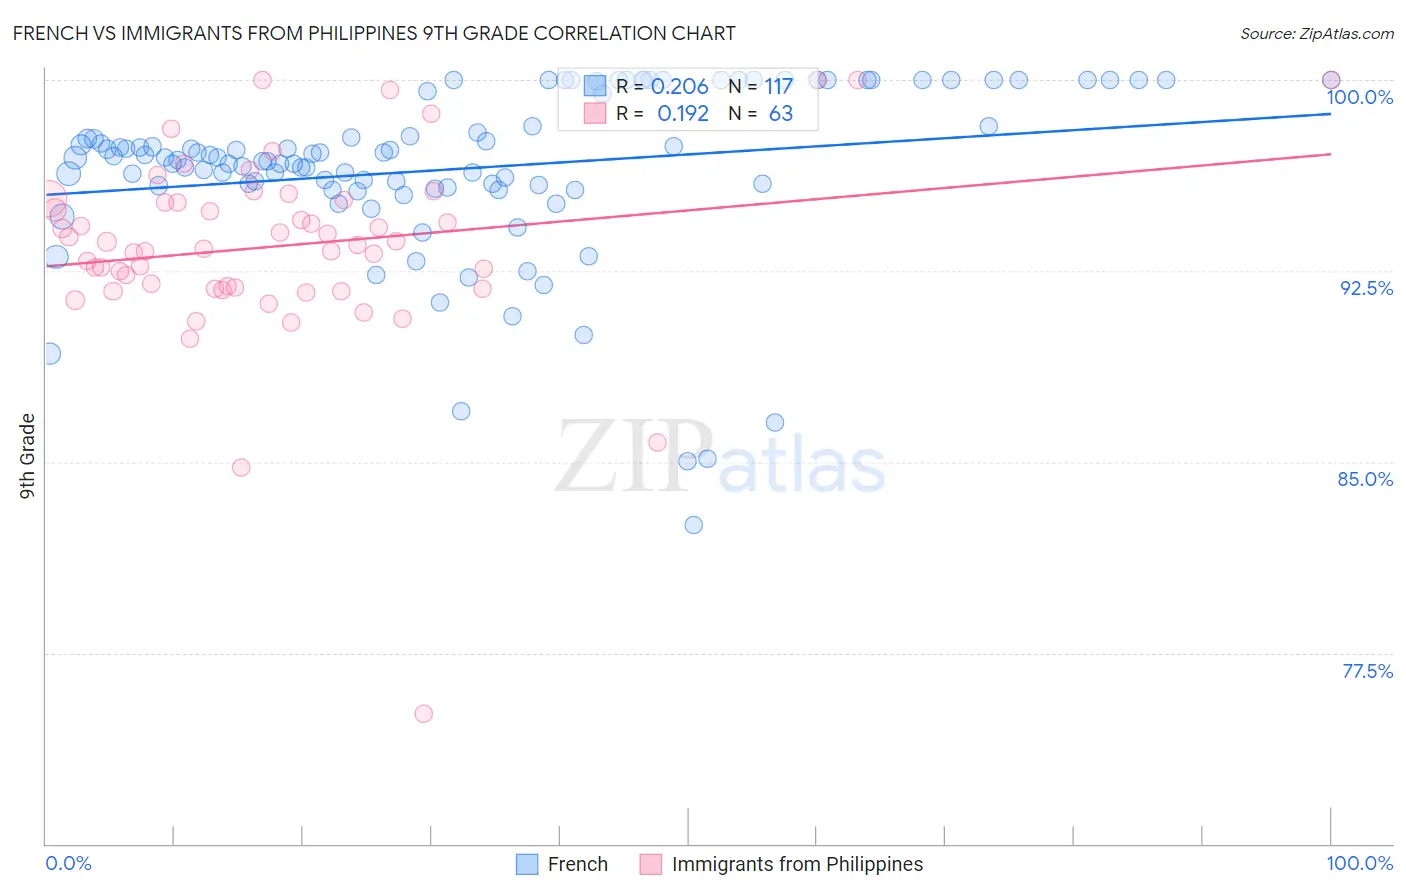
French vs Immigrants from Philippines 9th Grade Correlation Chart
The statistical analysis conducted on geographies consisting of 572,427,255 people shows a weak positive correlation between the proportion of French and percentage of population with at least 9th grade education in the United States with a correlation coefficient (R) of 0.206 and weighted average of 96.3%. Similarly, the statistical analysis conducted on geographies consisting of 471,300,535 people shows a poor positive correlation between the proportion of Immigrants from Philippines and percentage of population with at least 9th grade education in the United States with a correlation coefficient (R) of 0.192 and weighted average of 93.7%, a difference of 2.8%.
9th Grade Correlation Summary
| Measurement | French | Immigrants from Philippines |
| Minimum | 82.5% | 75.1% |
| Maximum | 100.0% | 100.0% |
| Range | 17.5% | 24.9% |
| Mean | 96.5% | 93.5% |
| Median | 96.9% | 93.5% |
| Interquartile 25% (IQ1) | 95.8% | 91.8% |
| Interquartile 75% (IQ3) | 99.5% | 95.3% |
| Interquartile Range (IQR) | 3.7% | 3.5% |
| Standard Deviation (Sample) | 3.4% | 3.8% |
| Standard Deviation (Population) | 3.4% | 3.8% |
Similar Demographics by 9th Grade
Demographics Similar to French by 9th Grade
In terms of 9th grade, the demographic groups most similar to French are Latvian (96.4%, a difference of 0.010%), French Canadian (96.3%, a difference of 0.030%), Czech (96.4%, a difference of 0.040%), Scotch-Irish (96.3%, a difference of 0.040%), and Eastern European (96.3%, a difference of 0.040%).
| Demographics | Rating | Rank | 9th Grade |
| Scandinavians | 100.0 /100 | #18 | Exceptional 96.5% |
| Welsh | 100.0 /100 | #19 | Exceptional 96.4% |
| Italians | 100.0 /100 | #20 | Exceptional 96.4% |
| Alaskan Athabascans | 100.0 /100 | #21 | Exceptional 96.4% |
| Europeans | 100.0 /100 | #22 | Exceptional 96.4% |
| Czechs | 100.0 /100 | #23 | Exceptional 96.4% |
| Latvians | 100.0 /100 | #24 | Exceptional 96.4% |
| French | 100.0 /100 | #25 | Exceptional 96.3% |
| French Canadians | 100.0 /100 | #26 | Exceptional 96.3% |
| Scotch-Irish | 100.0 /100 | #27 | Exceptional 96.3% |
| Eastern Europeans | 100.0 /100 | #28 | Exceptional 96.3% |
| Chinese | 100.0 /100 | #29 | Exceptional 96.3% |
| Maltese | 100.0 /100 | #30 | Exceptional 96.3% |
| British | 100.0 /100 | #31 | Exceptional 96.3% |
| Belgians | 100.0 /100 | #32 | Exceptional 96.3% |
Demographics Similar to Immigrants from Philippines by 9th Grade
In terms of 9th grade, the demographic groups most similar to Immigrants from Philippines are Immigrants from Eritrea (93.7%, a difference of 0.0%), West Indian (93.7%, a difference of 0.010%), Immigrants from Colombia (93.8%, a difference of 0.020%), Immigrants from South America (93.8%, a difference of 0.030%), and Peruvian (93.8%, a difference of 0.030%).
| Demographics | Rating | Rank | 9th Grade |
| Yuman | 0.2 /100 | #270 | Tragic 93.8% |
| Immigrants | Ghana | 0.2 /100 | #271 | Tragic 93.8% |
| Immigrants | Western Africa | 0.2 /100 | #272 | Tragic 93.8% |
| Immigrants | South America | 0.2 /100 | #273 | Tragic 93.8% |
| Peruvians | 0.2 /100 | #274 | Tragic 93.8% |
| Immigrants | Colombia | 0.2 /100 | #275 | Tragic 93.8% |
| West Indians | 0.2 /100 | #276 | Tragic 93.7% |
| Immigrants | Philippines | 0.1 /100 | #277 | Tragic 93.7% |
| Immigrants | Eritrea | 0.1 /100 | #278 | Tragic 93.7% |
| Trinidadians and Tobagonians | 0.1 /100 | #279 | Tragic 93.7% |
| Taiwanese | 0.1 /100 | #280 | Tragic 93.6% |
| Immigrants | Trinidad and Tobago | 0.1 /100 | #281 | Tragic 93.6% |
| Malaysians | 0.0 /100 | #282 | Tragic 93.5% |
| Barbadians | 0.0 /100 | #283 | Tragic 93.5% |
| Bangladeshis | 0.0 /100 | #284 | Tragic 93.4% |