Brazilian vs Tongan Unemployment Among Women with Children Under 6 years
COMPARE
Brazilian
Tongan
Unemployment Among Women with Children Under 6 years
Unemployment Among Women with Children Under 6 years Comparison
Brazilians
Tongans
7.7%
UNEMPLOYMENT AMONG WOMEN WITH CHILDREN UNDER 6 YEARS
43.9/ 100
METRIC RATING
181st/ 347
METRIC RANK
6.9%
UNEMPLOYMENT AMONG WOMEN WITH CHILDREN UNDER 6 YEARS
99.7/ 100
METRIC RATING
64th/ 347
METRIC RANK
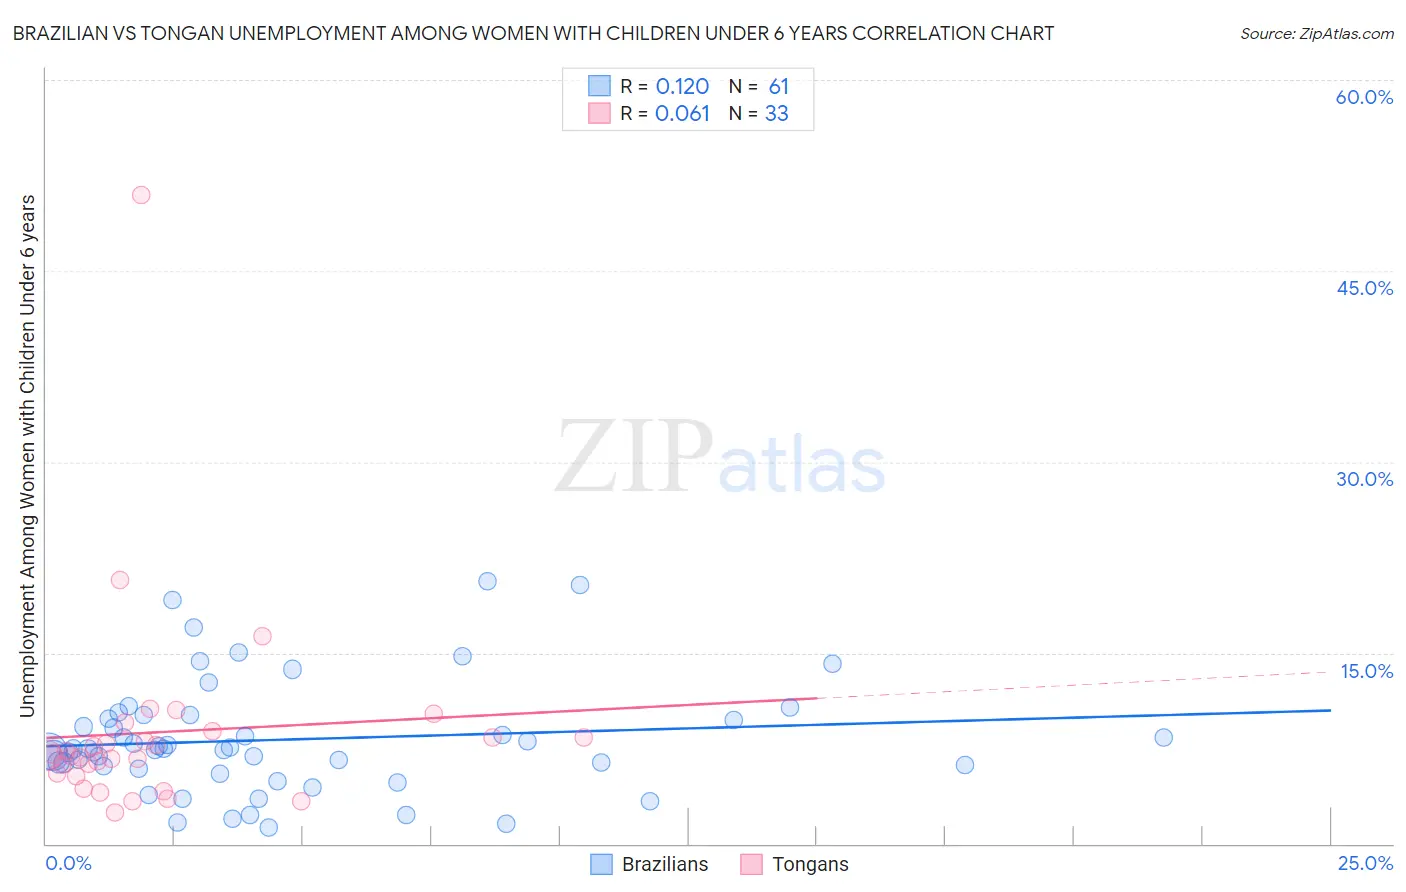
Brazilian vs Tongan Unemployment Among Women with Children Under 6 years Correlation Chart
The statistical analysis conducted on geographies consisting of 256,263,752 people shows a poor positive correlation between the proportion of Brazilians and unemployment rate among women with children under the age of 6 in the United States with a correlation coefficient (R) of 0.120 and weighted average of 7.7%. Similarly, the statistical analysis conducted on geographies consisting of 92,875,365 people shows a slight positive correlation between the proportion of Tongans and unemployment rate among women with children under the age of 6 in the United States with a correlation coefficient (R) of 0.061 and weighted average of 6.9%, a difference of 11.0%.
Unemployment Among Women with Children Under 6 years Correlation Summary
| Measurement | Brazilian | Tongan |
| Minimum | 1.3% | 2.5% |
| Maximum | 20.6% | 51.0% |
| Range | 19.3% | 48.5% |
| Mean | 8.2% | 8.8% |
| Median | 7.5% | 6.9% |
| Interquartile 25% (IQ1) | 6.0% | 5.4% |
| Interquartile 75% (IQ3) | 10.0% | 8.6% |
| Interquartile Range (IQR) | 4.0% | 3.1% |
| Standard Deviation (Sample) | 4.4% | 8.4% |
| Standard Deviation (Population) | 4.4% | 8.3% |
Similar Demographics by Unemployment Among Women with Children Under 6 years
Demographics Similar to Brazilians by Unemployment Among Women with Children Under 6 years
In terms of unemployment among women with children under 6 years, the demographic groups most similar to Brazilians are Nepalese (7.7%, a difference of 0.020%), Immigrants from Uruguay (7.7%, a difference of 0.040%), Immigrants from Western Europe (7.7%, a difference of 0.070%), Sierra Leonean (7.7%, a difference of 0.070%), and Immigrants from England (7.7%, a difference of 0.10%).
| Demographics | Rating | Rank | Unemployment Among Women with Children Under 6 years |
| Immigrants | Laos | 50.0 /100 | #174 | Average 7.6% |
| Panamanians | 49.6 /100 | #175 | Average 7.6% |
| Puget Sound Salish | 47.7 /100 | #176 | Average 7.7% |
| Austrians | 46.0 /100 | #177 | Average 7.7% |
| Immigrants | England | 45.4 /100 | #178 | Average 7.7% |
| Immigrants | Western Europe | 44.9 /100 | #179 | Average 7.7% |
| Immigrants | Uruguay | 44.5 /100 | #180 | Average 7.7% |
| Brazilians | 43.9 /100 | #181 | Average 7.7% |
| Nepalese | 43.5 /100 | #182 | Average 7.7% |
| Sierra Leoneans | 42.9 /100 | #183 | Average 7.7% |
| Indonesians | 40.5 /100 | #184 | Average 7.7% |
| Spanish Americans | 39.7 /100 | #185 | Fair 7.7% |
| Yugoslavians | 39.4 /100 | #186 | Fair 7.7% |
| Immigrants | Thailand | 38.5 /100 | #187 | Fair 7.7% |
| Czechoslovakians | 38.4 /100 | #188 | Fair 7.7% |
Demographics Similar to Tongans by Unemployment Among Women with Children Under 6 years
In terms of unemployment among women with children under 6 years, the demographic groups most similar to Tongans are Maltese (6.9%, a difference of 0.10%), Somali (6.9%, a difference of 0.15%), Immigrants from Kuwait (6.9%, a difference of 0.15%), Immigrants from France (6.9%, a difference of 0.19%), and Immigrants from Belgium (6.9%, a difference of 0.37%).
| Demographics | Rating | Rank | Unemployment Among Women with Children Under 6 years |
| Icelanders | 99.8 /100 | #57 | Exceptional 6.9% |
| Immigrants | Turkey | 99.8 /100 | #58 | Exceptional 6.9% |
| Immigrants | Serbia | 99.8 /100 | #59 | Exceptional 6.9% |
| Immigrants | Sri Lanka | 99.8 /100 | #60 | Exceptional 6.9% |
| Immigrants | France | 99.7 /100 | #61 | Exceptional 6.9% |
| Somalis | 99.7 /100 | #62 | Exceptional 6.9% |
| Maltese | 99.7 /100 | #63 | Exceptional 6.9% |
| Tongans | 99.7 /100 | #64 | Exceptional 6.9% |
| Immigrants | Kuwait | 99.7 /100 | #65 | Exceptional 6.9% |
| Immigrants | Belgium | 99.6 /100 | #66 | Exceptional 6.9% |
| Immigrants | Netherlands | 99.5 /100 | #67 | Exceptional 7.0% |
| Paraguayans | 99.4 /100 | #68 | Exceptional 7.0% |
| Immigrants | Eritrea | 99.4 /100 | #69 | Exceptional 7.0% |
| Immigrants | Iraq | 99.4 /100 | #70 | Exceptional 7.0% |
| Afghans | 99.4 /100 | #71 | Exceptional 7.0% |