Immigrants from Syria vs Senegalese Unemployment Among Ages 35 to 44 years
COMPARE
Immigrants from Syria
Senegalese
Unemployment Among Ages 35 to 44 years
Unemployment Among Ages 35 to 44 years Comparison
Immigrants from Syria
Senegalese
4.8%
UNEMPLOYMENT AMONG AGES 35 TO 44 YEARS
23.6/ 100
METRIC RATING
196th/ 347
METRIC RANK
5.3%
UNEMPLOYMENT AMONG AGES 35 TO 44 YEARS
0.0/ 100
METRIC RATING
272nd/ 347
METRIC RANK
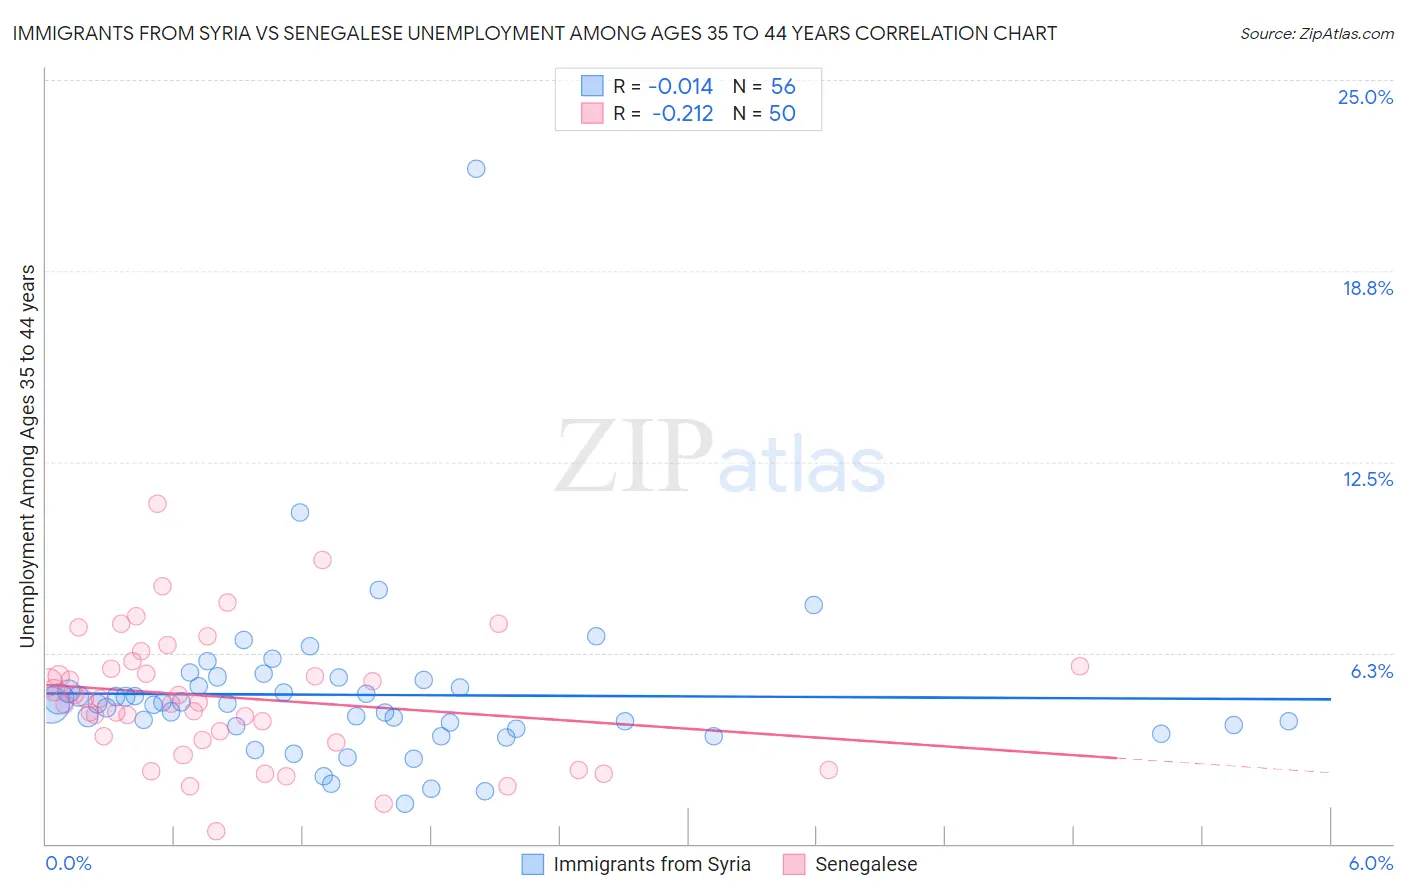
Immigrants from Syria vs Senegalese Unemployment Among Ages 35 to 44 years Correlation Chart
The statistical analysis conducted on geographies consisting of 172,815,511 people shows no correlation between the proportion of Immigrants from Syria and unemployment rate among population between the ages 35 and 44 in the United States with a correlation coefficient (R) of -0.014 and weighted average of 4.8%. Similarly, the statistical analysis conducted on geographies consisting of 77,874,000 people shows a weak negative correlation between the proportion of Senegalese and unemployment rate among population between the ages 35 and 44 in the United States with a correlation coefficient (R) of -0.212 and weighted average of 5.3%, a difference of 11.7%.
Unemployment Among Ages 35 to 44 years Correlation Summary
| Measurement | Immigrants from Syria | Senegalese |
| Minimum | 1.3% | 0.40% |
| Maximum | 22.1% | 11.1% |
| Range | 20.8% | 10.7% |
| Mean | 4.9% | 4.8% |
| Median | 4.6% | 4.7% |
| Interquartile 25% (IQ1) | 3.8% | 3.4% |
| Interquartile 75% (IQ3) | 5.3% | 5.8% |
| Interquartile Range (IQR) | 1.5% | 2.4% |
| Standard Deviation (Sample) | 2.9% | 2.1% |
| Standard Deviation (Population) | 2.8% | 2.1% |
Similar Demographics by Unemployment Among Ages 35 to 44 years
Demographics Similar to Immigrants from Syria by Unemployment Among Ages 35 to 44 years
In terms of unemployment among ages 35 to 44 years, the demographic groups most similar to Immigrants from Syria are Immigrants from Oceania (4.8%, a difference of 0.040%), Immigrants from Thailand (4.8%, a difference of 0.070%), Immigrants from Middle Africa (4.8%, a difference of 0.17%), Immigrants from Ukraine (4.8%, a difference of 0.22%), and Ugandan (4.8%, a difference of 0.22%).
| Demographics | Rating | Rank | Unemployment Among Ages 35 to 44 years |
| Immigrants | Congo | 33.9 /100 | #189 | Fair 4.7% |
| Immigrants | Southern Europe | 33.8 /100 | #190 | Fair 4.7% |
| Immigrants | South America | 33.8 /100 | #191 | Fair 4.7% |
| Immigrants | Albania | 30.5 /100 | #192 | Fair 4.8% |
| Spanish | 30.4 /100 | #193 | Fair 4.8% |
| Koreans | 28.1 /100 | #194 | Fair 4.8% |
| Bangladeshis | 28.0 /100 | #195 | Fair 4.8% |
| Immigrants | Syria | 23.6 /100 | #196 | Fair 4.8% |
| Immigrants | Oceania | 23.2 /100 | #197 | Fair 4.8% |
| Immigrants | Thailand | 22.9 /100 | #198 | Fair 4.8% |
| Immigrants | Middle Africa | 21.9 /100 | #199 | Fair 4.8% |
| Immigrants | Ukraine | 21.4 /100 | #200 | Fair 4.8% |
| Ugandans | 21.4 /100 | #201 | Fair 4.8% |
| Immigrants | Afghanistan | 20.2 /100 | #202 | Fair 4.8% |
| Uruguayans | 20.0 /100 | #203 | Fair 4.8% |
Demographics Similar to Senegalese by Unemployment Among Ages 35 to 44 years
In terms of unemployment among ages 35 to 44 years, the demographic groups most similar to Senegalese are Ute (5.3%, a difference of 0.010%), Blackfeet (5.3%, a difference of 0.18%), Vietnamese (5.4%, a difference of 0.18%), Creek (5.4%, a difference of 0.22%), and Immigrants from Mexico (5.4%, a difference of 0.30%).
| Demographics | Rating | Rank | Unemployment Among Ages 35 to 44 years |
| Yaqui | 0.1 /100 | #265 | Tragic 5.3% |
| Immigrants | Bangladesh | 0.1 /100 | #266 | Tragic 5.3% |
| Immigrants | Western Africa | 0.0 /100 | #267 | Tragic 5.3% |
| Hawaiians | 0.0 /100 | #268 | Tragic 5.3% |
| Cajuns | 0.0 /100 | #269 | Tragic 5.3% |
| Blackfeet | 0.0 /100 | #270 | Tragic 5.3% |
| Ute | 0.0 /100 | #271 | Tragic 5.3% |
| Senegalese | 0.0 /100 | #272 | Tragic 5.3% |
| Vietnamese | 0.0 /100 | #273 | Tragic 5.4% |
| Creek | 0.0 /100 | #274 | Tragic 5.4% |
| Immigrants | Mexico | 0.0 /100 | #275 | Tragic 5.4% |
| Native Hawaiians | 0.0 /100 | #276 | Tragic 5.4% |
| Immigrants | Caribbean | 0.0 /100 | #277 | Tragic 5.4% |
| Lumbee | 0.0 /100 | #278 | Tragic 5.4% |
| Immigrants | Senegal | 0.0 /100 | #279 | Tragic 5.4% |