French American Indian vs Senegalese Unemployment Among Ages 35 to 44 years
COMPARE
French American Indian
Senegalese
Unemployment Among Ages 35 to 44 years
Unemployment Among Ages 35 to 44 years Comparison
French American Indians
Senegalese
5.5%
UNEMPLOYMENT AMONG AGES 35 TO 44 YEARS
0.0/ 100
METRIC RATING
287th/ 347
METRIC RANK
5.3%
UNEMPLOYMENT AMONG AGES 35 TO 44 YEARS
0.0/ 100
METRIC RATING
272nd/ 347
METRIC RANK
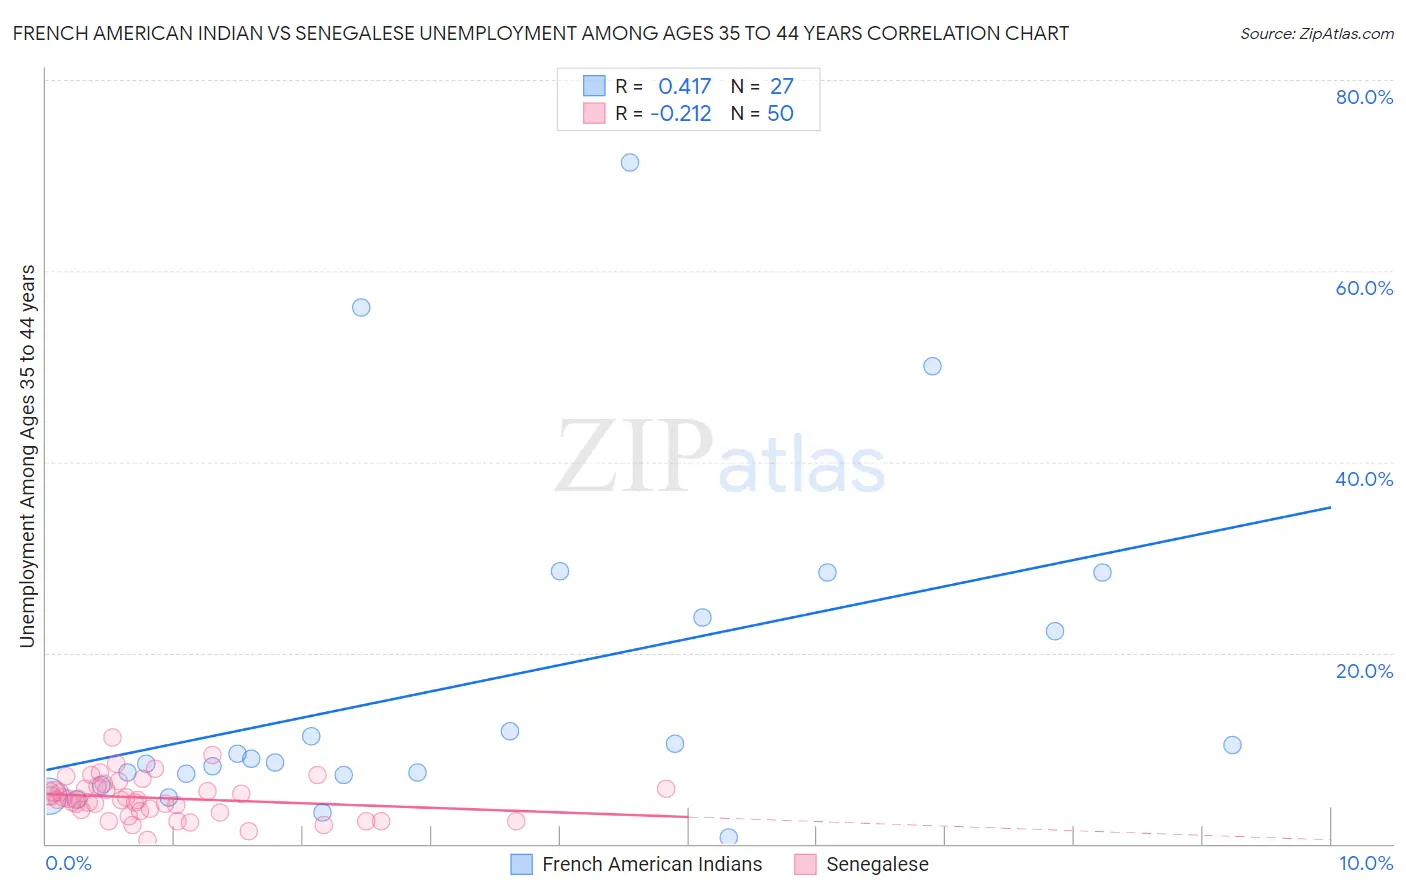
French American Indian vs Senegalese Unemployment Among Ages 35 to 44 years Correlation Chart
The statistical analysis conducted on geographies consisting of 130,378,290 people shows a moderate positive correlation between the proportion of French American Indians and unemployment rate among population between the ages 35 and 44 in the United States with a correlation coefficient (R) of 0.417 and weighted average of 5.5%. Similarly, the statistical analysis conducted on geographies consisting of 77,874,000 people shows a weak negative correlation between the proportion of Senegalese and unemployment rate among population between the ages 35 and 44 in the United States with a correlation coefficient (R) of -0.212 and weighted average of 5.3%, a difference of 2.9%.
Unemployment Among Ages 35 to 44 years Correlation Summary
| Measurement | French American Indian | Senegalese |
| Minimum | 0.70% | 0.40% |
| Maximum | 71.4% | 11.1% |
| Range | 70.7% | 10.7% |
| Mean | 16.7% | 4.8% |
| Median | 8.9% | 4.7% |
| Interquartile 25% (IQ1) | 7.2% | 3.4% |
| Interquartile 75% (IQ3) | 23.7% | 5.8% |
| Interquartile Range (IQR) | 16.5% | 2.4% |
| Standard Deviation (Sample) | 17.5% | 2.1% |
| Standard Deviation (Population) | 17.1% | 2.1% |
Demographics Similar to French American Indians and Senegalese by Unemployment Among Ages 35 to 44 years
In terms of unemployment among ages 35 to 44 years, the demographic groups most similar to French American Indians are Immigrants from Micronesia (5.5%, a difference of 0.12%), Cree (5.5%, a difference of 0.16%), Hispanic or Latino (5.5%, a difference of 0.24%), Haitian (5.5%, a difference of 0.40%), and Spanish American Indian (5.5%, a difference of 0.49%). Similarly, the demographic groups most similar to Senegalese are Ute (5.3%, a difference of 0.010%), Blackfeet (5.3%, a difference of 0.18%), Vietnamese (5.4%, a difference of 0.18%), Creek (5.4%, a difference of 0.22%), and Immigrants from Mexico (5.4%, a difference of 0.30%).
| Demographics | Rating | Rank | Unemployment Among Ages 35 to 44 years |
| Cajuns | 0.0 /100 | #269 | Tragic 5.3% |
| Blackfeet | 0.0 /100 | #270 | Tragic 5.3% |
| Ute | 0.0 /100 | #271 | Tragic 5.3% |
| Senegalese | 0.0 /100 | #272 | Tragic 5.3% |
| Vietnamese | 0.0 /100 | #273 | Tragic 5.4% |
| Creek | 0.0 /100 | #274 | Tragic 5.4% |
| Immigrants | Mexico | 0.0 /100 | #275 | Tragic 5.4% |
| Native Hawaiians | 0.0 /100 | #276 | Tragic 5.4% |
| Immigrants | Caribbean | 0.0 /100 | #277 | Tragic 5.4% |
| Lumbee | 0.0 /100 | #278 | Tragic 5.4% |
| Immigrants | Senegal | 0.0 /100 | #279 | Tragic 5.4% |
| Ecuadorians | 0.0 /100 | #280 | Tragic 5.4% |
| Immigrants | Portugal | 0.0 /100 | #281 | Tragic 5.4% |
| Immigrants | Ghana | 0.0 /100 | #282 | Tragic 5.4% |
| Immigrants | Ecuador | 0.0 /100 | #283 | Tragic 5.4% |
| Haitians | 0.0 /100 | #284 | Tragic 5.5% |
| Hispanics or Latinos | 0.0 /100 | #285 | Tragic 5.5% |
| Immigrants | Micronesia | 0.0 /100 | #286 | Tragic 5.5% |
| French American Indians | 0.0 /100 | #287 | Tragic 5.5% |
| Cree | 0.0 /100 | #288 | Tragic 5.5% |
| Spanish American Indians | 0.0 /100 | #289 | Tragic 5.5% |