French American Indian vs Immigrants from Bangladesh Unemployment Among Ages 35 to 44 years
COMPARE
French American Indian
Immigrants from Bangladesh
Unemployment Among Ages 35 to 44 years
Unemployment Among Ages 35 to 44 years Comparison
French American Indians
Immigrants from Bangladesh
5.5%
UNEMPLOYMENT AMONG AGES 35 TO 44 YEARS
0.0/ 100
METRIC RATING
287th/ 347
METRIC RANK
5.3%
UNEMPLOYMENT AMONG AGES 35 TO 44 YEARS
0.1/ 100
METRIC RATING
266th/ 347
METRIC RANK
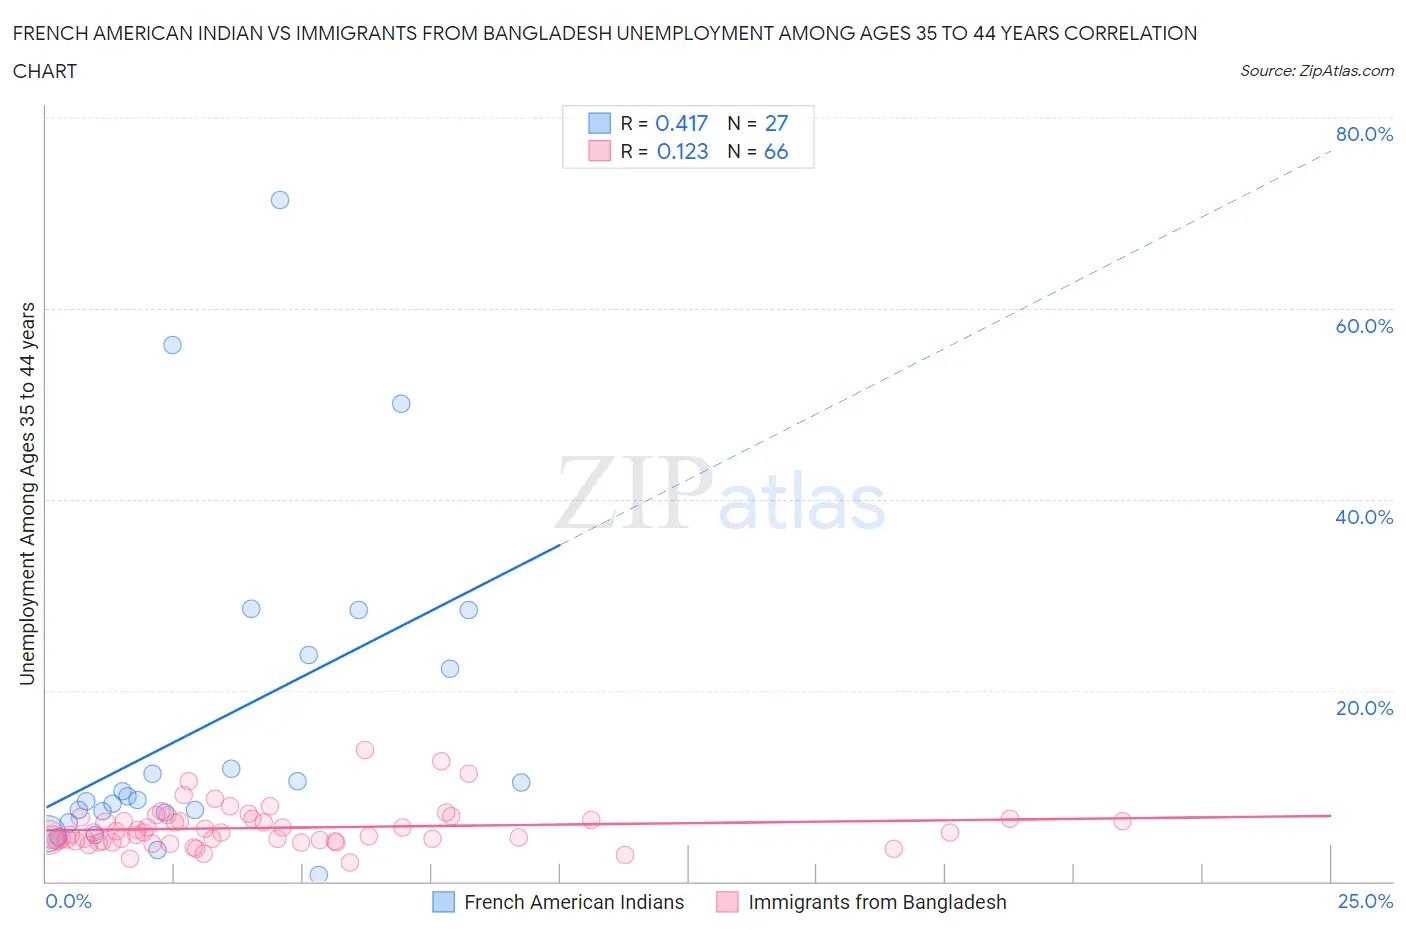
French American Indian vs Immigrants from Bangladesh Unemployment Among Ages 35 to 44 years Correlation Chart
The statistical analysis conducted on geographies consisting of 130,378,290 people shows a moderate positive correlation between the proportion of French American Indians and unemployment rate among population between the ages 35 and 44 in the United States with a correlation coefficient (R) of 0.417 and weighted average of 5.5%. Similarly, the statistical analysis conducted on geographies consisting of 202,422,179 people shows a poor positive correlation between the proportion of Immigrants from Bangladesh and unemployment rate among population between the ages 35 and 44 in the United States with a correlation coefficient (R) of 0.123 and weighted average of 5.3%, a difference of 3.4%.
Unemployment Among Ages 35 to 44 years Correlation Summary
| Measurement | French American Indian | Immigrants from Bangladesh |
| Minimum | 0.70% | 1.9% |
| Maximum | 71.4% | 13.7% |
| Range | 70.7% | 11.8% |
| Mean | 16.7% | 5.6% |
| Median | 8.9% | 5.0% |
| Interquartile 25% (IQ1) | 7.2% | 4.2% |
| Interquartile 75% (IQ3) | 23.7% | 6.5% |
| Interquartile Range (IQR) | 16.5% | 2.3% |
| Standard Deviation (Sample) | 17.5% | 2.2% |
| Standard Deviation (Population) | 17.1% | 2.2% |
Similar Demographics by Unemployment Among Ages 35 to 44 years
Demographics Similar to French American Indians by Unemployment Among Ages 35 to 44 years
In terms of unemployment among ages 35 to 44 years, the demographic groups most similar to French American Indians are Immigrants from Micronesia (5.5%, a difference of 0.12%), Cree (5.5%, a difference of 0.16%), Hispanic or Latino (5.5%, a difference of 0.24%), Haitian (5.5%, a difference of 0.40%), and Spanish American Indian (5.5%, a difference of 0.49%).
| Demographics | Rating | Rank | Unemployment Among Ages 35 to 44 years |
| Ecuadorians | 0.0 /100 | #280 | Tragic 5.4% |
| Immigrants | Portugal | 0.0 /100 | #281 | Tragic 5.4% |
| Immigrants | Ghana | 0.0 /100 | #282 | Tragic 5.4% |
| Immigrants | Ecuador | 0.0 /100 | #283 | Tragic 5.4% |
| Haitians | 0.0 /100 | #284 | Tragic 5.5% |
| Hispanics or Latinos | 0.0 /100 | #285 | Tragic 5.5% |
| Immigrants | Micronesia | 0.0 /100 | #286 | Tragic 5.5% |
| French American Indians | 0.0 /100 | #287 | Tragic 5.5% |
| Cree | 0.0 /100 | #288 | Tragic 5.5% |
| Spanish American Indians | 0.0 /100 | #289 | Tragic 5.5% |
| Jamaicans | 0.0 /100 | #290 | Tragic 5.5% |
| Dutch West Indians | 0.0 /100 | #291 | Tragic 5.5% |
| Immigrants | Haiti | 0.0 /100 | #292 | Tragic 5.5% |
| Central American Indians | 0.0 /100 | #293 | Tragic 5.6% |
| Trinidadians and Tobagonians | 0.0 /100 | #294 | Tragic 5.6% |
Demographics Similar to Immigrants from Bangladesh by Unemployment Among Ages 35 to 44 years
In terms of unemployment among ages 35 to 44 years, the demographic groups most similar to Immigrants from Bangladesh are Yaqui (5.3%, a difference of 0.020%), Immigrants from Western Africa (5.3%, a difference of 0.13%), Hawaiian (5.3%, a difference of 0.20%), Choctaw (5.3%, a difference of 0.21%), and Ghanaian (5.3%, a difference of 0.21%).
| Demographics | Rating | Rank | Unemployment Among Ages 35 to 44 years |
| Mexicans | 0.1 /100 | #259 | Tragic 5.3% |
| Sub-Saharan Africans | 0.1 /100 | #260 | Tragic 5.3% |
| Spanish Americans | 0.1 /100 | #261 | Tragic 5.3% |
| Immigrants | Central America | 0.1 /100 | #262 | Tragic 5.3% |
| Choctaw | 0.1 /100 | #263 | Tragic 5.3% |
| Ghanaians | 0.1 /100 | #264 | Tragic 5.3% |
| Yaqui | 0.1 /100 | #265 | Tragic 5.3% |
| Immigrants | Bangladesh | 0.1 /100 | #266 | Tragic 5.3% |
| Immigrants | Western Africa | 0.0 /100 | #267 | Tragic 5.3% |
| Hawaiians | 0.0 /100 | #268 | Tragic 5.3% |
| Cajuns | 0.0 /100 | #269 | Tragic 5.3% |
| Blackfeet | 0.0 /100 | #270 | Tragic 5.3% |
| Ute | 0.0 /100 | #271 | Tragic 5.3% |
| Senegalese | 0.0 /100 | #272 | Tragic 5.3% |
| Vietnamese | 0.0 /100 | #273 | Tragic 5.4% |