French American Indian vs Immigrants from Western Asia Kindergarten
COMPARE
French American Indian
Immigrants from Western Asia
Kindergarten
Kindergarten Comparison
French American Indians
Immigrants from Western Asia
98.0%
KINDERGARTEN
63.7/ 100
METRIC RATING
159th/ 347
METRIC RANK
97.7%
KINDERGARTEN
2.1/ 100
METRIC RATING
236th/ 347
METRIC RANK
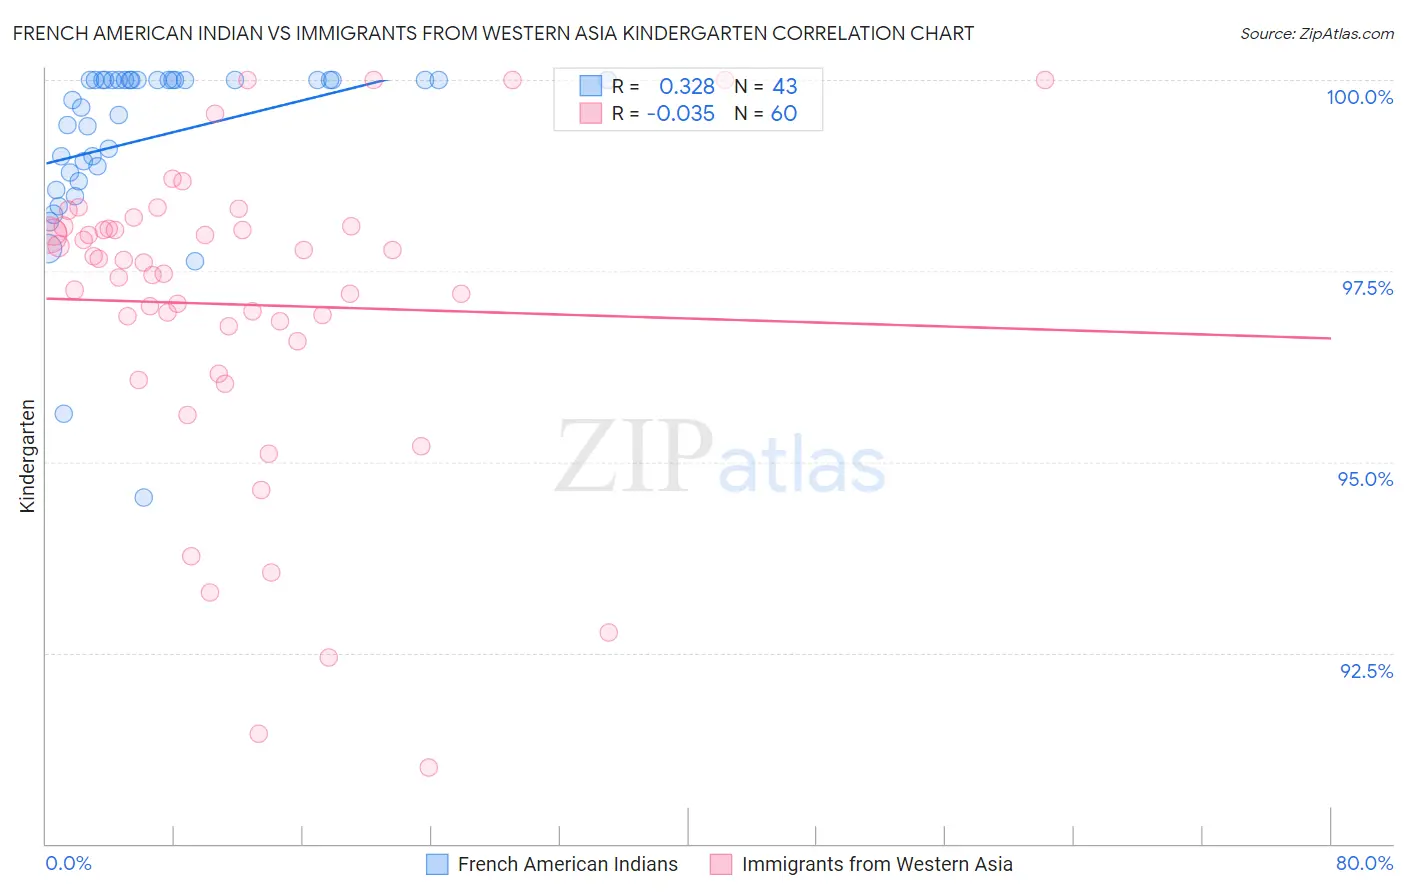
French American Indian vs Immigrants from Western Asia Kindergarten Correlation Chart
The statistical analysis conducted on geographies consisting of 131,974,854 people shows a mild positive correlation between the proportion of French American Indians and percentage of population with at least kindergarten education in the United States with a correlation coefficient (R) of 0.328 and weighted average of 98.0%. Similarly, the statistical analysis conducted on geographies consisting of 404,424,892 people shows no correlation between the proportion of Immigrants from Western Asia and percentage of population with at least kindergarten education in the United States with a correlation coefficient (R) of -0.035 and weighted average of 97.7%, a difference of 0.34%.
Kindergarten Correlation Summary
| Measurement | French American Indian | Immigrants from Western Asia |
| Minimum | 94.5% | 91.0% |
| Maximum | 100.0% | 100.0% |
| Range | 5.5% | 9.0% |
| Mean | 99.2% | 97.1% |
| Median | 100.0% | 97.6% |
| Interquartile 25% (IQ1) | 98.8% | 96.7% |
| Interquartile 75% (IQ3) | 100.0% | 98.1% |
| Interquartile Range (IQR) | 1.2% | 1.4% |
| Standard Deviation (Sample) | 1.2% | 2.0% |
| Standard Deviation (Population) | 1.2% | 2.0% |
Similar Demographics by Kindergarten
Demographics Similar to French American Indians by Kindergarten
In terms of kindergarten, the demographic groups most similar to French American Indians are Venezuelan (98.0%, a difference of 0.0%), Immigrants from South Central Asia (98.0%, a difference of 0.010%), Immigrants from North Macedonia (98.0%, a difference of 0.010%), Dutch West Indian (98.0%, a difference of 0.020%), and Immigrants from Moldova (98.0%, a difference of 0.020%).
| Demographics | Rating | Rank | Kindergarten |
| Dutch West Indians | 70.1 /100 | #152 | Good 98.0% |
| Immigrants | Moldova | 69.1 /100 | #153 | Good 98.0% |
| Immigrants | Iran | 68.8 /100 | #154 | Good 98.0% |
| Comanche | 68.3 /100 | #155 | Good 98.0% |
| Immigrants | South Central Asia | 66.6 /100 | #156 | Good 98.0% |
| Immigrants | North Macedonia | 66.4 /100 | #157 | Good 98.0% |
| Venezuelans | 64.7 /100 | #158 | Good 98.0% |
| French American Indians | 63.7 /100 | #159 | Good 98.0% |
| Immigrants | Russia | 59.0 /100 | #160 | Average 98.0% |
| Immigrants | Eastern Europe | 59.0 /100 | #161 | Average 98.0% |
| Immigrants | Italy | 58.9 /100 | #162 | Average 98.0% |
| Spanish Americans | 57.8 /100 | #163 | Average 98.0% |
| Immigrants | Micronesia | 57.7 /100 | #164 | Average 98.0% |
| Ugandans | 56.9 /100 | #165 | Average 98.0% |
| Chileans | 56.3 /100 | #166 | Average 98.0% |
Demographics Similar to Immigrants from Western Asia by Kindergarten
In terms of kindergarten, the demographic groups most similar to Immigrants from Western Asia are Immigrants from Pakistan (97.7%, a difference of 0.0%), Immigrants from Malaysia (97.7%, a difference of 0.0%), Colombian (97.7%, a difference of 0.0%), Immigrants from Uruguay (97.7%, a difference of 0.010%), and Nigerian (97.6%, a difference of 0.010%).
| Demographics | Rating | Rank | Kindergarten |
| Sierra Leoneans | 3.4 /100 | #229 | Tragic 97.7% |
| Senegalese | 3.3 /100 | #230 | Tragic 97.7% |
| Puerto Ricans | 2.7 /100 | #231 | Tragic 97.7% |
| Immigrants | Uruguay | 2.6 /100 | #232 | Tragic 97.7% |
| Immigrants | Pakistan | 2.2 /100 | #233 | Tragic 97.7% |
| Immigrants | Malaysia | 2.2 /100 | #234 | Tragic 97.7% |
| Colombians | 2.2 /100 | #235 | Tragic 97.7% |
| Immigrants | Western Asia | 2.1 /100 | #236 | Tragic 97.7% |
| Nigerians | 1.8 /100 | #237 | Tragic 97.6% |
| Immigrants | Eastern Asia | 1.7 /100 | #238 | Tragic 97.6% |
| U.S. Virgin Islanders | 1.7 /100 | #239 | Tragic 97.6% |
| Koreans | 1.6 /100 | #240 | Tragic 97.6% |
| Liberians | 1.3 /100 | #241 | Tragic 97.6% |
| Immigrants | Indonesia | 1.3 /100 | #242 | Tragic 97.6% |
| Asians | 1.2 /100 | #243 | Tragic 97.6% |