Filipino vs Puerto Rican Male Unemployment
COMPARE
Filipino
Puerto Rican
Male Unemployment
Male Unemployment Comparison
Filipinos
Puerto Ricans
4.7%
MALE UNEMPLOYMENT
99.9/ 100
METRIC RATING
17th/ 347
METRIC RANK
8.6%
MALE UNEMPLOYMENT
0.0/ 100
METRIC RATING
337th/ 347
METRIC RANK
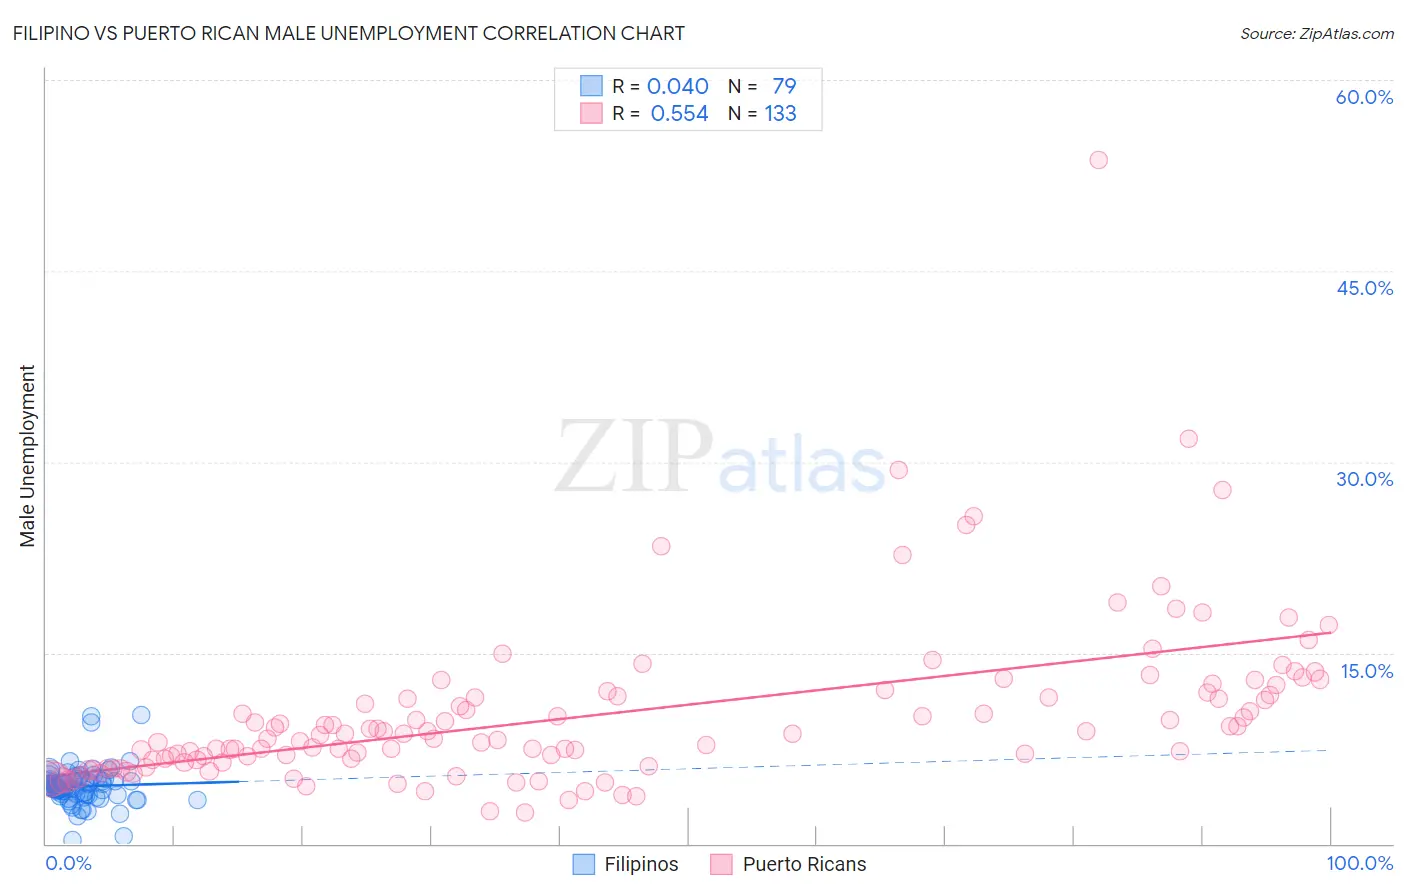
Filipino vs Puerto Rican Male Unemployment Correlation Chart
The statistical analysis conducted on geographies consisting of 253,897,394 people shows no correlation between the proportion of Filipinos and unemployment rate among males in the United States with a correlation coefficient (R) of 0.040 and weighted average of 4.7%. Similarly, the statistical analysis conducted on geographies consisting of 523,207,266 people shows a substantial positive correlation between the proportion of Puerto Ricans and unemployment rate among males in the United States with a correlation coefficient (R) of 0.554 and weighted average of 8.6%, a difference of 81.1%.
Male Unemployment Correlation Summary
| Measurement | Filipino | Puerto Rican |
| Minimum | 0.30% | 2.5% |
| Maximum | 10.1% | 53.7% |
| Range | 9.8% | 51.2% |
| Mean | 4.5% | 10.2% |
| Median | 4.4% | 8.6% |
| Interquartile 25% (IQ1) | 3.8% | 6.5% |
| Interquartile 75% (IQ3) | 5.1% | 11.8% |
| Interquartile Range (IQR) | 1.3% | 5.4% |
| Standard Deviation (Sample) | 1.5% | 6.6% |
| Standard Deviation (Population) | 1.5% | 6.5% |
Similar Demographics by Male Unemployment
Demographics Similar to Filipinos by Male Unemployment
In terms of male unemployment, the demographic groups most similar to Filipinos are English (4.8%, a difference of 0.30%), European (4.8%, a difference of 0.32%), Pennsylvania German (4.8%, a difference of 0.38%), Immigrants from Taiwan (4.8%, a difference of 0.54%), and Carpatho Rusyn (4.8%, a difference of 0.55%).
| Demographics | Rating | Rank | Male Unemployment |
| Cubans | 100.0 /100 | #10 | Exceptional 4.6% |
| Swedes | 100.0 /100 | #11 | Exceptional 4.6% |
| Immigrants | Bolivia | 100.0 /100 | #12 | Exceptional 4.7% |
| Bolivians | 100.0 /100 | #13 | Exceptional 4.7% |
| Germans | 100.0 /100 | #14 | Exceptional 4.7% |
| Scandinavians | 100.0 /100 | #15 | Exceptional 4.7% |
| Swiss | 99.9 /100 | #16 | Exceptional 4.7% |
| Filipinos | 99.9 /100 | #17 | Exceptional 4.7% |
| English | 99.9 /100 | #18 | Exceptional 4.8% |
| Europeans | 99.9 /100 | #19 | Exceptional 4.8% |
| Pennsylvania Germans | 99.9 /100 | #20 | Exceptional 4.8% |
| Immigrants | Taiwan | 99.9 /100 | #21 | Exceptional 4.8% |
| Carpatho Rusyns | 99.9 /100 | #22 | Exceptional 4.8% |
| Tongans | 99.9 /100 | #23 | Exceptional 4.8% |
| Immigrants | South Central Asia | 99.9 /100 | #24 | Exceptional 4.8% |
Demographics Similar to Puerto Ricans by Male Unemployment
In terms of male unemployment, the demographic groups most similar to Puerto Ricans are Yuman (8.6%, a difference of 0.080%), Apache (8.6%, a difference of 0.15%), Pueblo (8.5%, a difference of 1.4%), Tsimshian (8.5%, a difference of 1.5%), and Sioux (8.4%, a difference of 2.5%).
| Demographics | Rating | Rank | Male Unemployment |
| Yakama | 0.0 /100 | #330 | Tragic 7.9% |
| Alaska Natives | 0.0 /100 | #331 | Tragic 8.1% |
| Pima | 0.0 /100 | #332 | Tragic 8.3% |
| Sioux | 0.0 /100 | #333 | Tragic 8.4% |
| Tsimshian | 0.0 /100 | #334 | Tragic 8.5% |
| Pueblo | 0.0 /100 | #335 | Tragic 8.5% |
| Yuman | 0.0 /100 | #336 | Tragic 8.6% |
| Puerto Ricans | 0.0 /100 | #337 | Tragic 8.6% |
| Apache | 0.0 /100 | #338 | Tragic 8.6% |
| Cheyenne | 0.0 /100 | #339 | Tragic 9.8% |
| Alaskan Athabascans | 0.0 /100 | #340 | Tragic 9.8% |
| Navajo | 0.0 /100 | #341 | Tragic 9.8% |
| Tohono O'odham | 0.0 /100 | #342 | Tragic 10.2% |
| Crow | 0.0 /100 | #343 | Tragic 10.6% |
| Hopi | 0.0 /100 | #344 | Tragic 10.8% |