Fijian vs Ghanaian Unemployment Among Ages 65 to 74 years
COMPARE
Fijian
Ghanaian
Unemployment Among Ages 65 to 74 years
Unemployment Among Ages 65 to 74 years Comparison
Fijians
Ghanaians
4.5%
UNEMPLOYMENT AMONG AGES 65 TO 74 YEARS
100.0/ 100
METRIC RATING
3rd/ 347
METRIC RANK
5.6%
UNEMPLOYMENT AMONG AGES 65 TO 74 YEARS
1.4/ 100
METRIC RATING
240th/ 347
METRIC RANK
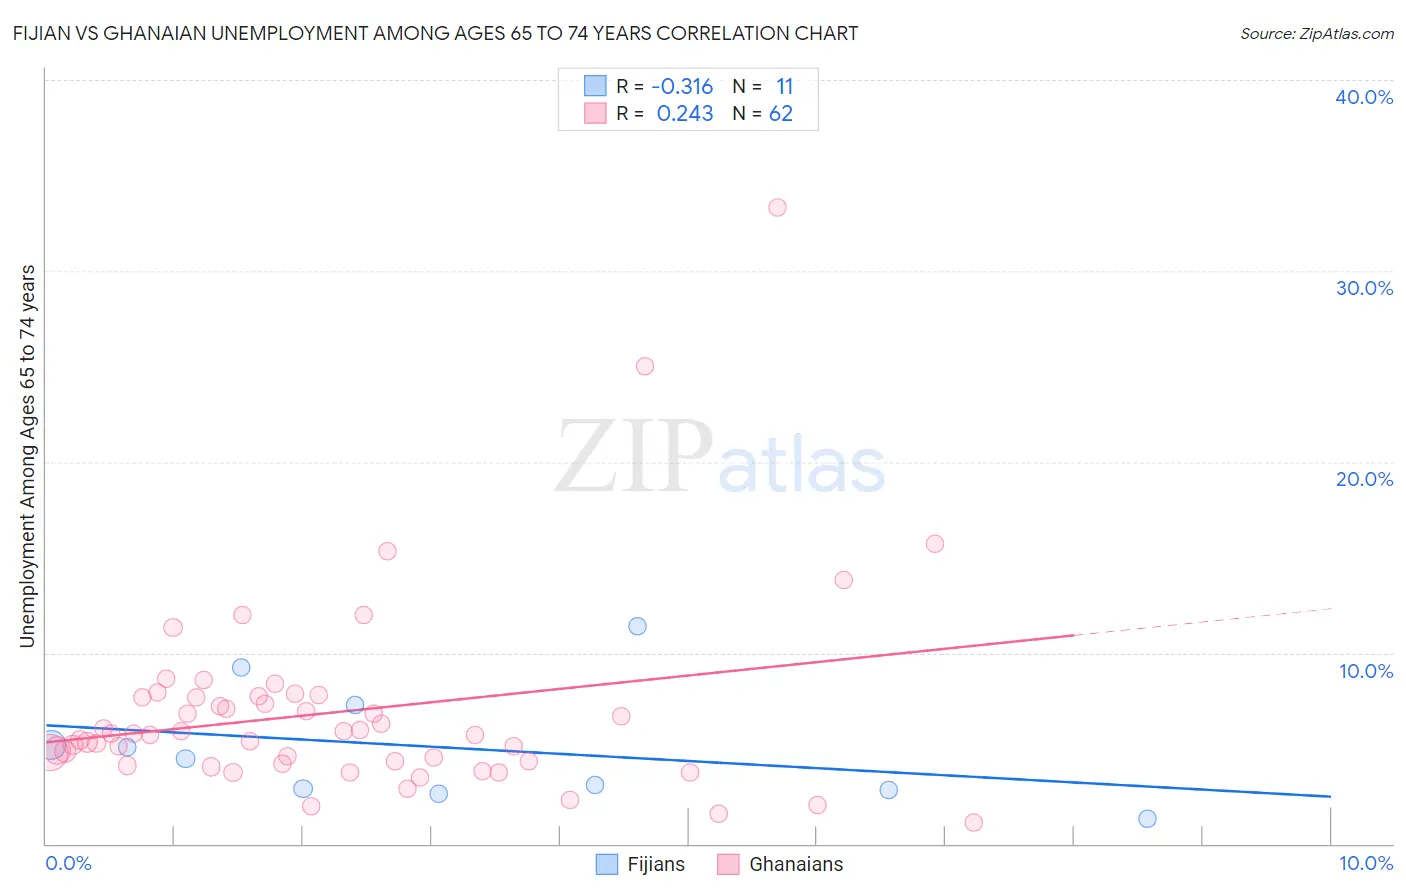
Fijian vs Ghanaian Unemployment Among Ages 65 to 74 years Correlation Chart
The statistical analysis conducted on geographies consisting of 52,432,761 people shows a mild negative correlation between the proportion of Fijians and unemployment rate among population between the ages 65 and 74 in the United States with a correlation coefficient (R) of -0.316 and weighted average of 4.5%. Similarly, the statistical analysis conducted on geographies consisting of 178,641,718 people shows a weak positive correlation between the proportion of Ghanaians and unemployment rate among population between the ages 65 and 74 in the United States with a correlation coefficient (R) of 0.243 and weighted average of 5.6%, a difference of 22.9%.
Unemployment Among Ages 65 to 74 years Correlation Summary
| Measurement | Fijian | Ghanaian |
| Minimum | 1.3% | 1.1% |
| Maximum | 11.4% | 33.3% |
| Range | 10.1% | 32.2% |
| Mean | 5.0% | 6.9% |
| Median | 4.4% | 5.7% |
| Interquartile 25% (IQ1) | 2.8% | 4.3% |
| Interquartile 75% (IQ3) | 7.3% | 7.7% |
| Interquartile Range (IQR) | 4.5% | 3.4% |
| Standard Deviation (Sample) | 3.1% | 5.1% |
| Standard Deviation (Population) | 3.0% | 5.1% |
Similar Demographics by Unemployment Among Ages 65 to 74 years
Demographics Similar to Fijians by Unemployment Among Ages 65 to 74 years
In terms of unemployment among ages 65 to 74 years, the demographic groups most similar to Fijians are Tsimshian (4.6%, a difference of 1.5%), Chinese (4.4%, a difference of 1.6%), Sudanese (4.6%, a difference of 1.9%), Immigrants from Cuba (4.6%, a difference of 2.4%), and Indonesian (4.7%, a difference of 3.9%).
| Demographics | Rating | Rank | Unemployment Among Ages 65 to 74 years |
| Hmong | 100.0 /100 | #1 | Exceptional 4.2% |
| Chinese | 100.0 /100 | #2 | Exceptional 4.4% |
| Fijians | 100.0 /100 | #3 | Exceptional 4.5% |
| Tsimshian | 100.0 /100 | #4 | Exceptional 4.6% |
| Sudanese | 100.0 /100 | #5 | Exceptional 4.6% |
| Immigrants | Cuba | 100.0 /100 | #6 | Exceptional 4.6% |
| Indonesians | 100.0 /100 | #7 | Exceptional 4.7% |
| Comanche | 100.0 /100 | #8 | Exceptional 4.7% |
| Chickasaw | 100.0 /100 | #9 | Exceptional 4.7% |
| Osage | 100.0 /100 | #10 | Exceptional 4.7% |
| Immigrants | Congo | 100.0 /100 | #11 | Exceptional 4.7% |
| Tongans | 100.0 /100 | #12 | Exceptional 4.7% |
| Lumbee | 100.0 /100 | #13 | Exceptional 4.8% |
| Cubans | 100.0 /100 | #14 | Exceptional 4.8% |
| Immigrants | North Macedonia | 100.0 /100 | #15 | Exceptional 4.8% |
Demographics Similar to Ghanaians by Unemployment Among Ages 65 to 74 years
In terms of unemployment among ages 65 to 74 years, the demographic groups most similar to Ghanaians are Cree (5.6%, a difference of 0.030%), Immigrants from Ghana (5.6%, a difference of 0.040%), Immigrants from Peru (5.6%, a difference of 0.090%), German Russian (5.5%, a difference of 0.10%), and Cajun (5.5%, a difference of 0.17%).
| Demographics | Rating | Rank | Unemployment Among Ages 65 to 74 years |
| South American Indians | 2.3 /100 | #233 | Tragic 5.5% |
| French American Indians | 2.2 /100 | #234 | Tragic 5.5% |
| Peruvians | 2.2 /100 | #235 | Tragic 5.5% |
| Hopi | 2.2 /100 | #236 | Tragic 5.5% |
| Immigrants | Belize | 2.2 /100 | #237 | Tragic 5.5% |
| Cajuns | 1.8 /100 | #238 | Tragic 5.5% |
| German Russians | 1.6 /100 | #239 | Tragic 5.5% |
| Ghanaians | 1.4 /100 | #240 | Tragic 5.6% |
| Cree | 1.4 /100 | #241 | Tragic 5.6% |
| Immigrants | Ghana | 1.4 /100 | #242 | Tragic 5.6% |
| Immigrants | Peru | 1.3 /100 | #243 | Tragic 5.6% |
| Immigrants | Micronesia | 0.9 /100 | #244 | Tragic 5.6% |
| Immigrants | Greece | 0.9 /100 | #245 | Tragic 5.6% |
| Paraguayans | 0.9 /100 | #246 | Tragic 5.6% |
| Immigrants | Immigrants | 0.9 /100 | #247 | Tragic 5.6% |