European vs Immigrants from Croatia Unemployment Among Youth under 25 years
COMPARE
European
Immigrants from Croatia
Unemployment Among Youth under 25 years
Unemployment Among Youth under 25 years Comparison
Europeans
Immigrants from Croatia
10.8%
UNEMPLOYMENT AMONG YOUTH UNDER 25 YEARS
99.9/ 100
METRIC RATING
33rd/ 347
METRIC RANK
11.1%
UNEMPLOYMENT AMONG YOUTH UNDER 25 YEARS
98.1/ 100
METRIC RATING
63rd/ 347
METRIC RANK
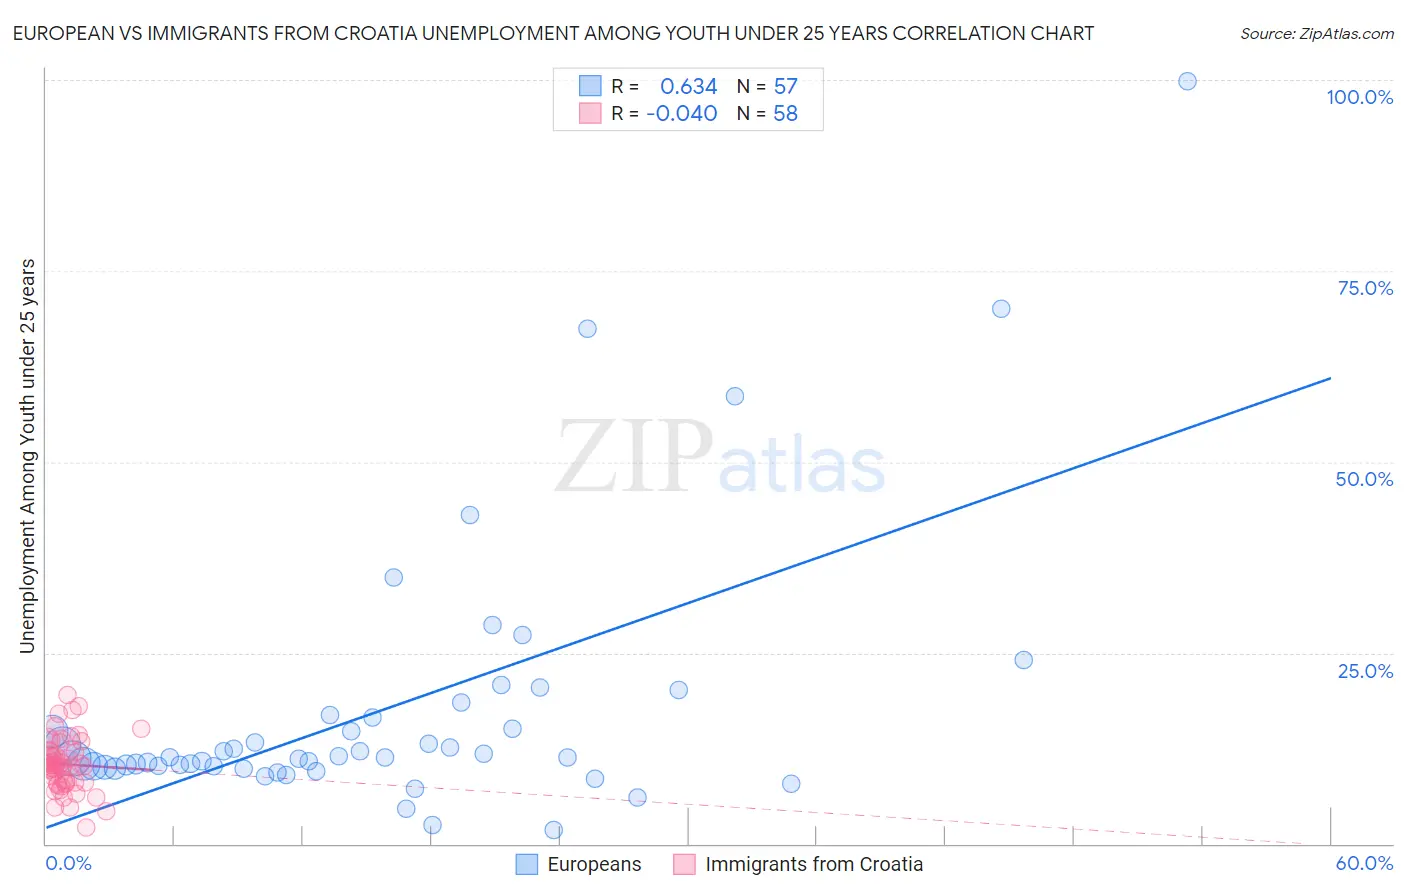
European vs Immigrants from Croatia Unemployment Among Youth under 25 years Correlation Chart
The statistical analysis conducted on geographies consisting of 539,832,325 people shows a significant positive correlation between the proportion of Europeans and unemployment rate among youth under the age of 25 in the United States with a correlation coefficient (R) of 0.634 and weighted average of 10.8%. Similarly, the statistical analysis conducted on geographies consisting of 132,077,248 people shows no correlation between the proportion of Immigrants from Croatia and unemployment rate among youth under the age of 25 in the United States with a correlation coefficient (R) of -0.040 and weighted average of 11.1%, a difference of 3.3%.
Unemployment Among Youth under 25 years Correlation Summary
| Measurement | European | Immigrants from Croatia |
| Minimum | 1.8% | 2.2% |
| Maximum | 99.9% | 19.5% |
| Range | 98.1% | 17.3% |
| Mean | 17.5% | 10.4% |
| Median | 11.3% | 10.2% |
| Interquartile 25% (IQ1) | 10.1% | 8.1% |
| Interquartile 75% (IQ3) | 16.7% | 11.9% |
| Interquartile Range (IQR) | 6.6% | 3.9% |
| Standard Deviation (Sample) | 17.7% | 3.4% |
| Standard Deviation (Population) | 17.5% | 3.4% |
Similar Demographics by Unemployment Among Youth under 25 years
Demographics Similar to Europeans by Unemployment Among Youth under 25 years
In terms of unemployment among youth under 25 years, the demographic groups most similar to Europeans are Taiwanese (10.8%, a difference of 0.22%), English (10.8%, a difference of 0.27%), Immigrants from Nepal (10.8%, a difference of 0.35%), Slovene (10.7%, a difference of 0.48%), and Hmong (10.8%, a difference of 0.48%).
| Demographics | Rating | Rank | Unemployment Among Youth under 25 years |
| Immigrants | India | 100.0 /100 | #26 | Exceptional 10.7% |
| Yugoslavians | 100.0 /100 | #27 | Exceptional 10.7% |
| Somalis | 100.0 /100 | #28 | Exceptional 10.7% |
| Chinese | 99.9 /100 | #29 | Exceptional 10.7% |
| Osage | 99.9 /100 | #30 | Exceptional 10.7% |
| Slovenes | 99.9 /100 | #31 | Exceptional 10.7% |
| Taiwanese | 99.9 /100 | #32 | Exceptional 10.8% |
| Europeans | 99.9 /100 | #33 | Exceptional 10.8% |
| English | 99.9 /100 | #34 | Exceptional 10.8% |
| Immigrants | Nepal | 99.9 /100 | #35 | Exceptional 10.8% |
| Hmong | 99.8 /100 | #36 | Exceptional 10.8% |
| Immigrants | Zimbabwe | 99.8 /100 | #37 | Exceptional 10.8% |
| Immigrants | Congo | 99.8 /100 | #38 | Exceptional 10.9% |
| Immigrants | Zaire | 99.8 /100 | #39 | Exceptional 10.9% |
| Scottish | 99.8 /100 | #40 | Exceptional 10.9% |
Demographics Similar to Immigrants from Croatia by Unemployment Among Youth under 25 years
In terms of unemployment among youth under 25 years, the demographic groups most similar to Immigrants from Croatia are Immigrants from Netherlands (11.1%, a difference of 0.010%), Filipino (11.1%, a difference of 0.10%), Jordanian (11.1%, a difference of 0.12%), Immigrants from Singapore (11.2%, a difference of 0.18%), and Macedonian (11.2%, a difference of 0.21%).
| Demographics | Rating | Rank | Unemployment Among Youth under 25 years |
| Immigrants | Saudi Arabia | 98.8 /100 | #56 | Exceptional 11.1% |
| Immigrants | Eritrea | 98.8 /100 | #57 | Exceptional 11.1% |
| Scotch-Irish | 98.8 /100 | #58 | Exceptional 11.1% |
| Immigrants | Eastern Africa | 98.7 /100 | #59 | Exceptional 11.1% |
| South Africans | 98.5 /100 | #60 | Exceptional 11.1% |
| Filipinos | 98.3 /100 | #61 | Exceptional 11.1% |
| Immigrants | Netherlands | 98.1 /100 | #62 | Exceptional 11.1% |
| Immigrants | Croatia | 98.1 /100 | #63 | Exceptional 11.1% |
| Jordanians | 97.9 /100 | #64 | Exceptional 11.1% |
| Immigrants | Singapore | 97.8 /100 | #65 | Exceptional 11.2% |
| Macedonians | 97.7 /100 | #66 | Exceptional 11.2% |
| Chickasaw | 97.7 /100 | #67 | Exceptional 11.2% |
| Immigrants | Kenya | 97.6 /100 | #68 | Exceptional 11.2% |
| Immigrants | Moldova | 97.5 /100 | #69 | Exceptional 11.2% |
| Slavs | 97.5 /100 | #70 | Exceptional 11.2% |