European vs English Unemployment Among Youth under 25 years
COMPARE
European
English
Unemployment Among Youth under 25 years
Unemployment Among Youth under 25 years Comparison
Europeans
English
10.8%
UNEMPLOYMENT AMONG YOUTH UNDER 25 YEARS
99.9/ 100
METRIC RATING
33rd/ 347
METRIC RANK
10.8%
UNEMPLOYMENT AMONG YOUTH UNDER 25 YEARS
99.9/ 100
METRIC RATING
34th/ 347
METRIC RANK
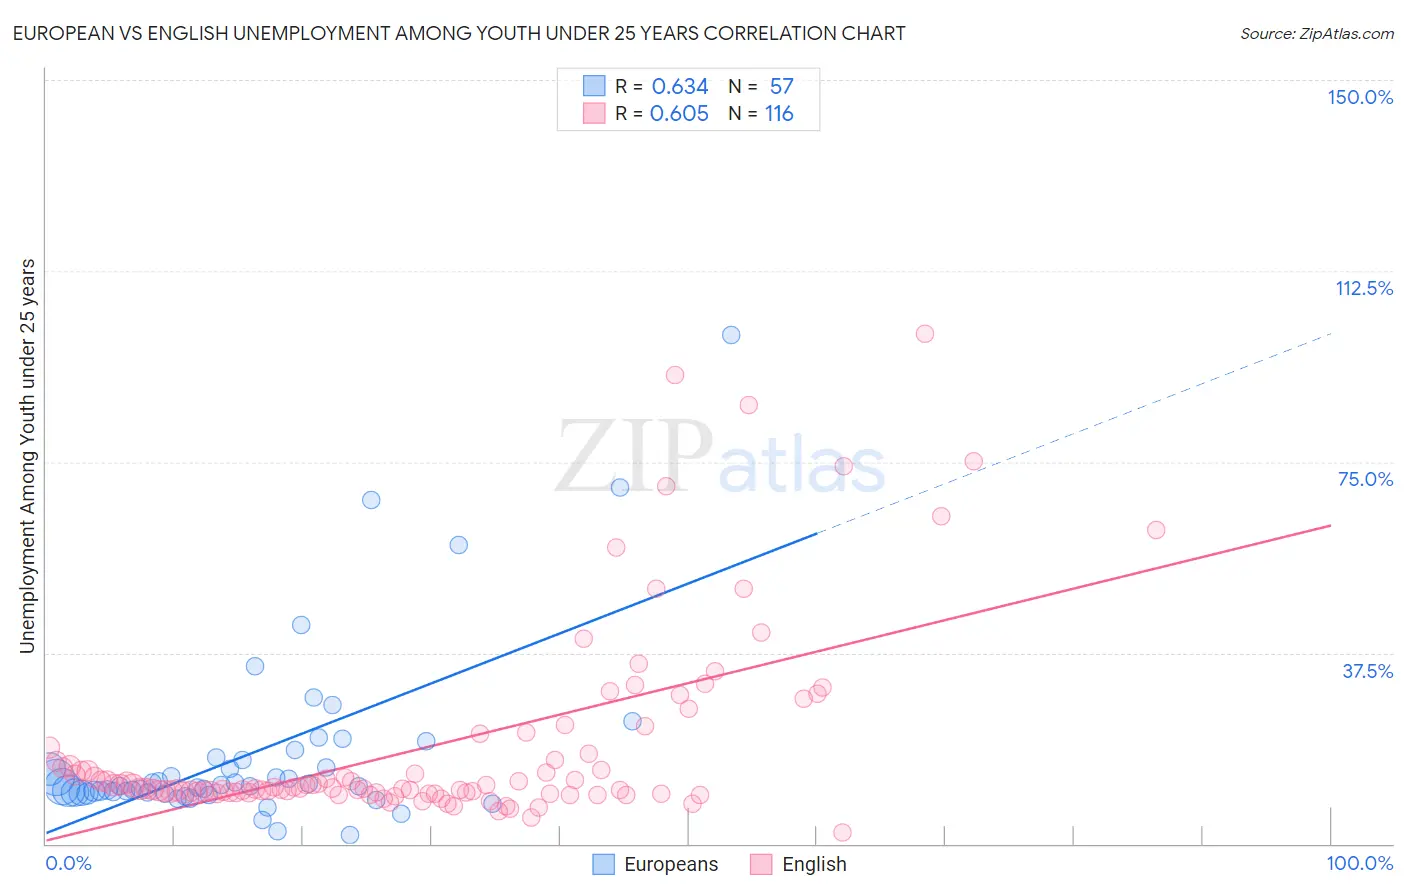
European vs English Unemployment Among Youth under 25 years Correlation Chart
The statistical analysis conducted on geographies consisting of 539,832,325 people shows a significant positive correlation between the proportion of Europeans and unemployment rate among youth under the age of 25 in the United States with a correlation coefficient (R) of 0.634 and weighted average of 10.8%. Similarly, the statistical analysis conducted on geographies consisting of 551,535,354 people shows a significant positive correlation between the proportion of English and unemployment rate among youth under the age of 25 in the United States with a correlation coefficient (R) of 0.605 and weighted average of 10.8%, a difference of 0.27%.
Unemployment Among Youth under 25 years Correlation Summary
| Measurement | European | English |
| Minimum | 1.8% | 2.2% |
| Maximum | 99.9% | 100.1% |
| Range | 98.1% | 97.9% |
| Mean | 17.5% | 19.1% |
| Median | 11.3% | 10.9% |
| Interquartile 25% (IQ1) | 10.1% | 10.1% |
| Interquartile 75% (IQ3) | 16.7% | 17.1% |
| Interquartile Range (IQR) | 6.6% | 7.0% |
| Standard Deviation (Sample) | 17.7% | 19.0% |
| Standard Deviation (Population) | 17.5% | 18.9% |
Demographics Similar to Europeans and English by Unemployment Among Youth under 25 years
In terms of unemployment among youth under 25 years, the demographic groups most similar to Europeans are Taiwanese (10.8%, a difference of 0.22%), Immigrants from Nepal (10.8%, a difference of 0.35%), Slovene (10.7%, a difference of 0.48%), Hmong (10.8%, a difference of 0.48%), and Osage (10.7%, a difference of 0.60%). Similarly, the demographic groups most similar to English are Immigrants from Nepal (10.8%, a difference of 0.080%), Hmong (10.8%, a difference of 0.21%), Immigrants from Zimbabwe (10.8%, a difference of 0.36%), Immigrants from Congo (10.9%, a difference of 0.43%), and Immigrants from Zaire (10.9%, a difference of 0.45%).
| Demographics | Rating | Rank | Unemployment Among Youth under 25 years |
| Immigrants | Bosnia and Herzegovina | 100.0 /100 | #23 | Exceptional 10.6% |
| Finns | 100.0 /100 | #24 | Exceptional 10.7% |
| Immigrants | North Macedonia | 100.0 /100 | #25 | Exceptional 10.7% |
| Immigrants | India | 100.0 /100 | #26 | Exceptional 10.7% |
| Yugoslavians | 100.0 /100 | #27 | Exceptional 10.7% |
| Somalis | 100.0 /100 | #28 | Exceptional 10.7% |
| Chinese | 99.9 /100 | #29 | Exceptional 10.7% |
| Osage | 99.9 /100 | #30 | Exceptional 10.7% |
| Slovenes | 99.9 /100 | #31 | Exceptional 10.7% |
| Taiwanese | 99.9 /100 | #32 | Exceptional 10.8% |
| Europeans | 99.9 /100 | #33 | Exceptional 10.8% |
| English | 99.9 /100 | #34 | Exceptional 10.8% |
| Immigrants | Nepal | 99.9 /100 | #35 | Exceptional 10.8% |
| Hmong | 99.8 /100 | #36 | Exceptional 10.8% |
| Immigrants | Zimbabwe | 99.8 /100 | #37 | Exceptional 10.8% |
| Immigrants | Congo | 99.8 /100 | #38 | Exceptional 10.9% |
| Immigrants | Zaire | 99.8 /100 | #39 | Exceptional 10.9% |
| Scottish | 99.8 /100 | #40 | Exceptional 10.9% |
| Croatians | 99.8 /100 | #41 | Exceptional 10.9% |
| Cambodians | 99.7 /100 | #42 | Exceptional 10.9% |
| British | 99.7 /100 | #43 | Exceptional 10.9% |